

Asset allocation:
A phrase that consistently gets overlooked in the investment management industry. An industry that devotes an enormous amount of time and resources to security selection — whether it is manager due diligence, entry point timing, identifying stocks with breakout potential, and so on. It is where fees are justified, where broadcast programs focus, and where most conversations are held. Yet decades of evidence point elsewhere. The most important decision in portfolio construction is not what you own, but how your capital is allocated across asset classes.
This piece will highlight the significance of strategic asset allocation — the foundational framework that distributes capital across equities, fixed income, and alternative asset classes based on an investor’s risk profile, time horizon, and return objectives. In a world where market noise is becoming increasingly overwhelming for both the average market participant and investment professional alike, it is worth revisiting the fundamentals. Leonardo da Vinci said it best, “simplicity is the ultimate sophistication,” which resonates deeply in portfolio construction as asset allocation remains a primary determinant of long-term portfolio outcomes.
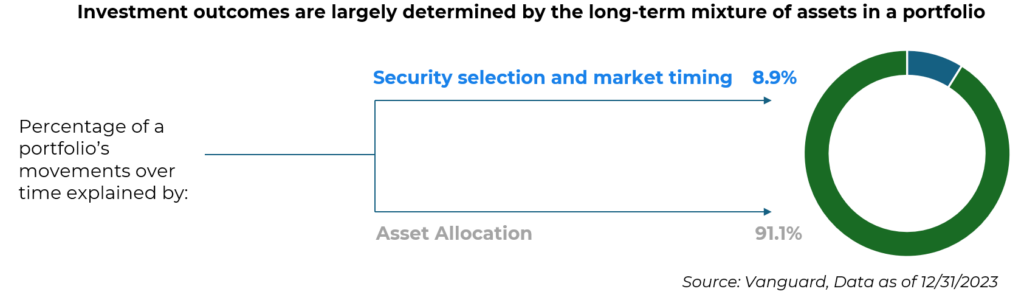
The idea of asset allocation starts back in 1986 with three influential research figures in Gary Brinson, L. Randolph Hood, and Gilbert Beebower — commonly referred to as BHB. The significance of BHB was their rigorous study of what drives portfolio returns, examining 91 large U.S. pension plans over more than a decade. From this, BHB discovered that asset allocation explained roughly 94% of the variation in total returns with security selection and market timing accounting for the small remainder. Later on in 2000, two more highly esteemed researchers in the field, Roger Ibbotson and Paul Kaplan, extended the work of BHB reaching very similar results. Nearly 90% of the variability was driven by the asset allocation policy. However, 1986 and 2000 were many years ago, so it is crucial to understand if this piece of research is still applicable in today’s endlessly evolving markets. Vanguard, one of the largest asset managers on the planet, posted similar findings for 2023 year-end, which continues to support the case in today’s landscape.
These findings give us a strong foundation of portfolio construction and building truly diversified portfolios, however, security selection and fund manager due diligence should not be neglected. As each day passes, we hear about new funds being launched to the marketplace and the “differentiated” approach it claims to offer. It is important to block out the noise, truly understand the funds, and perform thorough qualitative and quantitative analysis before giving them the green light. For example, active versus passive management is a large headline argued amongst professionals, particularly whether actively managed funds are worth the higher fees. Skilled active management can be a meaningful driver of portfolio returns, as it can add value in less efficient segments in the market. As manager performance dispersion can be wide across all asset classes, identifying the truly dominant managers is vital for additional alpha generation across portfolios. To paint the picture of asset class performance and its never-ending surprises, below is the periodic table of investment returns by the Callan Institute. Every single year is vastly different from the one before, but within each category asset class there is the opportunity to pinpoint a manager that checks every box across the board. The appropriate strategic asset allocation alongside a fund manager with a proven track record is nearly impossible to beat.
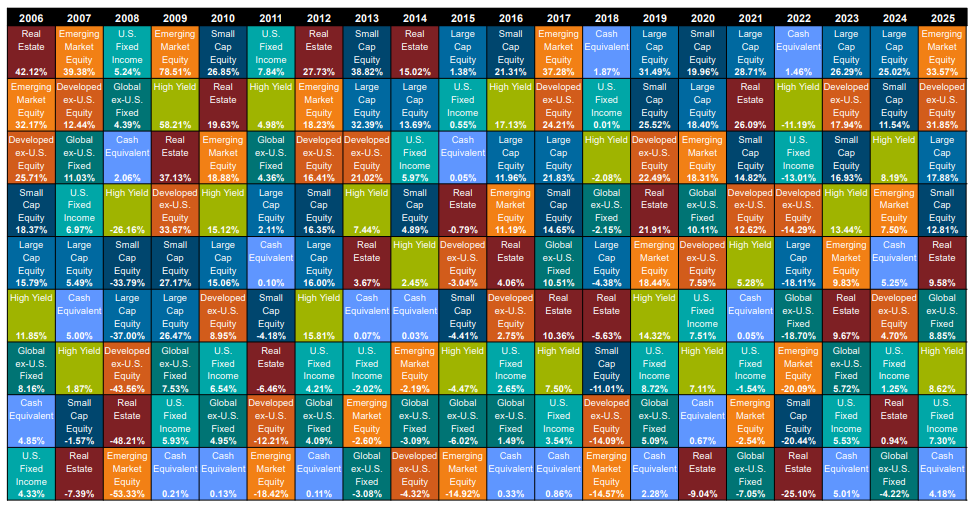
Source: Callan Periodic Table of Investment Returns, Data as of 12/31/25
There is no list of Do’s and Don’ts or a list of the best way to construct a portfolio that will deliver the highest returns over a period of time. There are so many variables that go into the construction and design of a portfolio, but what the evidence points to is a hierarchy of investment decisions. Asset allocation sits on the top of the pyramid as it determines your overall exposure to various asset classes with different risk components to each. The chart below by Vanguard illustrates this point — as equity exposure increases from left to right, both the average return and the range of outcomes change meaningfully. One’s risk appetite will determine the appropriate balance of stock to bond exposure, but the graph perfectly displays the notion of “higher risk, higher return.” All other decisions like the best fund manager, tilting toward value over growth, overweighting short duration bonds, and many others have their place, but each operates in the overarching framework of asset allocation that was already established.
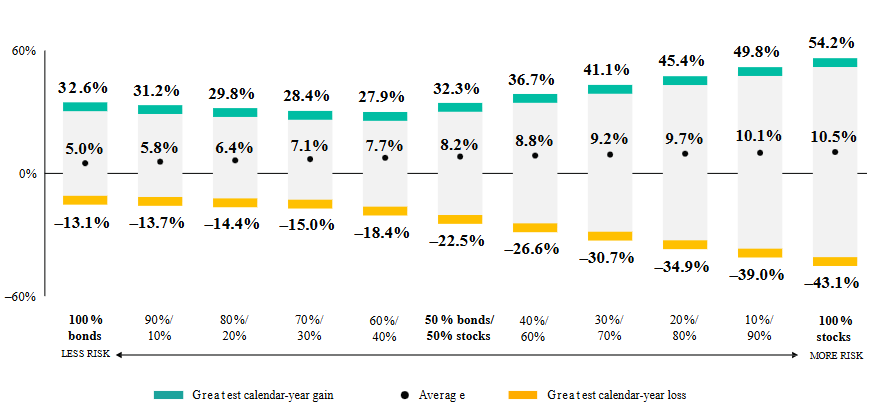
Source: Vanguard, “Model Portfolio Allocation”, Date as of 12/31/2024
The building blocks of portfolio construction can vary across the industry, but At Trademark Financial Management, decades of evidence points to one principle — across our investment consulting, outsourced CIO, and third-party asset management services: structure before selection. In other words, asset allocation remains the primary determinant of long-term portfolio performance. Build out the structure and allocation first, then turn to who should fill the spots. Manager selection and market timing have their place — just not in the driver’s seat.
References:
Brinson, G.P., Hood, L.R., and Beebower, G.L. (1986). “Determinants of Portfolio Performance.” Financial Analysts Journal, 42(4), 39–44.
Ibbotson, R.G., and Kaplan, P.D. (2000). “Does Asset Allocation Policy Explain 40, 90, or 100 Percent of Performance?” Financial Analysts Journal, 56(1), 26–33.
Vanguard. “Model Portfolio Allocation.” Investor Resources & Education.
Callan Institute. “Periodic Table of Investment Returns.” Data as of 12/31/2025.
DISCLOSURE
Past performance is no assurance of future results. Trademark Financial Management, LLC (“Trademark”) is a registered investment adviser with its principal place of business in the State of Minnesota. Trademark and its representatives are in compliance with registration requirements imposed upon investment advisers by those states in which Trademark operates. Trademark may only transact business in those states in which it is registered or qualifies for an exemption or exclusion from registration. This newsletter is limited to the dissemination of general information pertaining to its investment advisory/management services. Any subsequent, direct communication by Trademark with a prospective client shall be conducted by a representative that is either registered or qualifies for an exemption or exclusion from registration in the state where the prospective client resides. A complete list of all recommendations will be provided if requested for the preceding period of not less than one year. It should not be assumed that recommendations made in the future will be profitable or will equal the performance of the securities in this list. Opinions expressed are those of Trademark Financial Management and are subject to change, not guaranteed and should not be considered recommendations to buy or sell any security. For information pertaining to the registration status of Trademark please contact Trademark at (952) 358-3395 or refer to the Investment Adviser Public Disclosure web site (www.adviserinfo.sec.gov). For additional information about Trademark, including fees and services, send for our disclosure statement as set forth on Form ADV from us using the contact information herein or by calling 952-358-3395. Please read the disclosure statement carefully before you invest or send money. Any reference to a chart, graph, formula, or software as a source of analysis used by Trademark Financial Management staff is one of many factors used to make investment decisions for your portfolio. No one graph, chart, formula, or software can in and of itself be used to determine which securities to buy or sell, when to buy or sell them, or assist any person in making decisions as to which securities to buy or sell or when to buy or sell them. Any chart, graph, formula, or software used is limited by the data entered and the created parameters. The data was obtained from third parties deemed by the adviser to be reliable. Nonetheless, the adviser has not verified the results and cannot be assured of their accuracy.