

Stocks, Bonds, and Gold Correlations
Source: YCharts (SPY, AGG, IAU as proxies)
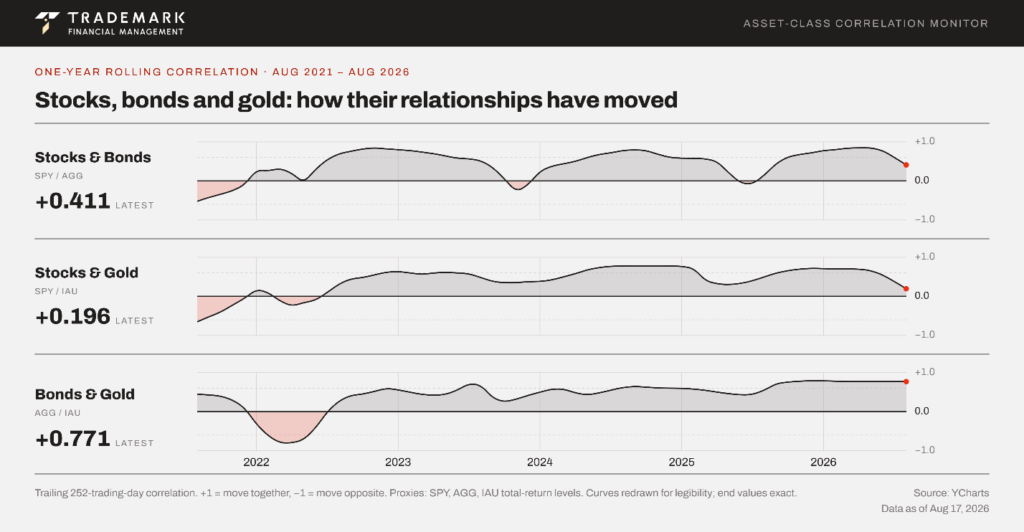
Correlations have been a cornerstone of risk reduction since the earliest days of modern portfolio theory, yet many investors haven’t paid close attention until recently. As I’ve written before, 2022 was the wake-up call, the year stocks and bonds broke down harshly together and reminded everyone that the relationships we rely on for diversification are anything but fixed. The chart above gives us an understanding of cross asset allocation between stocks, bonds, and gold on a one-year trailing basis over the past five years. As you can see, correlations amongst the three remain in positive territory and have been ever since the start of one of the most prolific rate hiking periods of 2022 that was driven by high inflation. The primary reason for the positive correlation comes down to one thing, interest rates. More recently, though, two of these relationships have started to roll over.
- • Stocks & Bonds: The drop in correlation isn’t really about fading inflation concerns or the market’s shift toward the labor market after a weak jobs report. It’s being driven more by recent fiscal worries, heavy Treasury issuance, a roughly $1.8T deficit, and $1T in annual interest on a national debt just reaching $40T, among other pressures. Those concerns are pushing yields up and bond prices down, even as stocks continue to climb, which pulls the two apart.
- • Stocks & Gold: This one is turning negative for a simpler reason, the actual paths the two have taken. Stocks have ground steadily higher all year, while gold ran hard early, gave most of it back through the spring and summer, and only found its footing again in early August. For much of the past six months, that meant the two were moving in opposite directions, stocks up, gold down, which is enough to pull the trailing one-year correlation lower. It’s a good reminder that these longer-term readings are often driven by what’s happened most recently.
ETF Flows Concentrate into Technology, Then Cool
Source: Baird Strategas, Bloomberg, ETF Action
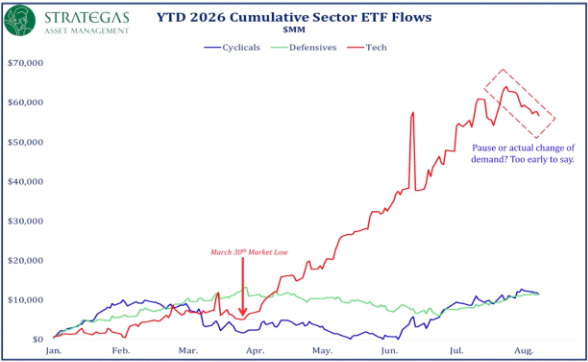
We have seen a ridiculous number of inflows into ETFs this year as investors continue to realize the tax efficiency behind the investment vehicle over mutual funds. Looking behind the curtain, you see that the leader amongst sectors is technology, which is no surprise to anyone. Artificial intelligence (AI) has taken the world by storm, and investors poured in roughly $60B before a more recent slowdown in flows. The pace of demand for technology exposure has cooled recently, but this is far from unusual. Investors who have made a nice return will take profits and rotate capital elsewhere, because the one thing you cannot argue is the concentration risk within the technology sector and the increasing skepticism behind the massive capital expenditures of AI. That capital has to go somewhere, and lately some of it has found its way into defensives. Healthcare in particular has quietly outperformed over the past month, a classic sign that investors are rotating toward steadier, less crowded corners of the market as enthusiasm for high-flying tech cools.
A Historic Day for an mRNA Cancer Vaccine
Source: Google Finance Charting
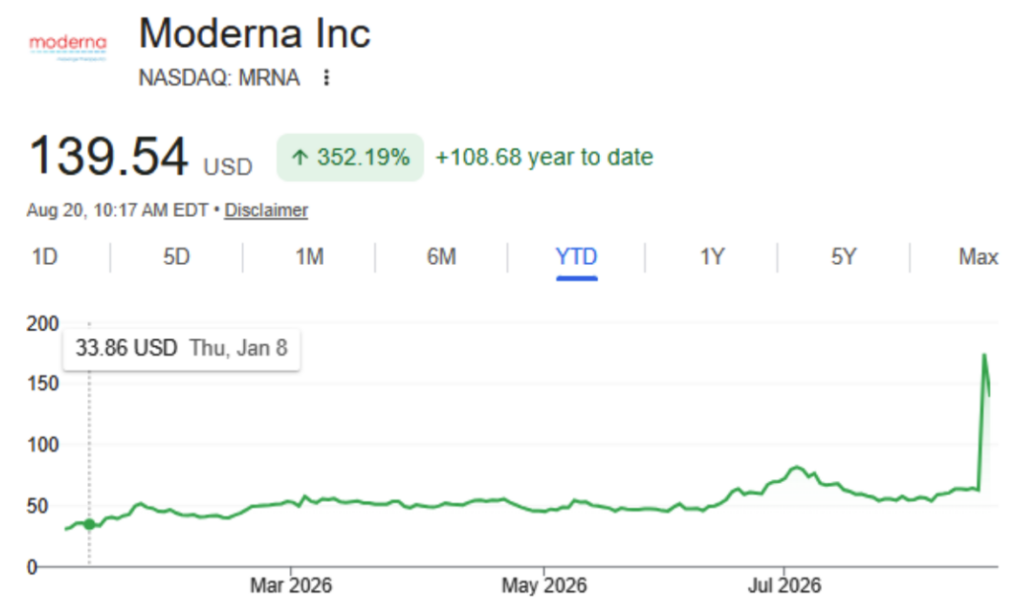
Speaking of healthcare, the strong-performing sector I mentioned earlier, there was some notable news this week. On Wednesday, August 19, Moderna and fellow American company Merck announced that their experimental mRNA-based cancer vaccine hit its primary goal in a phase 3 clinical trial. The vaccine, called intismeran, is tailored to the genetic sequencing of each individual’s tumor. Used alongside Merck’s immunotherapy drug Keytruda, intismeran dramatically reduced the recurrence of melanoma and kept it from spreading. Driven by this news, the stock gapped up significantly from $62.96 and closed at a price of $174.38, marking an incredible increase of +177%. I spend my days thinking about markets and the economy, but every now and then a piece of news reminds you of what actually matters. Cancer has touched nearly everyone in some way, and a treatment that keeps melanoma from returning isn’t just a win for a stock, it’s a win for all of us.
The AI Circular Economy
Source: JPMorgan
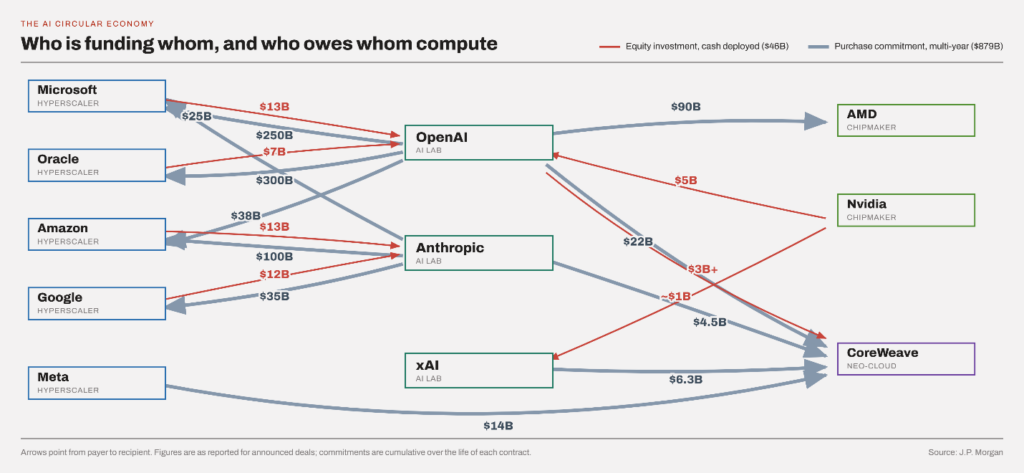
The chart above has been making its way around news outlets and LinkedIn for some time now, and JPMorgan recently revised it with updated figures. This is the “AI Circular Economy,” an excellent visual depiction of the financing between all the major players in the AI ecosystem. There’s a lot going on here, so let me break it down. The red arrows are equity investments, real cash deployed for the AI buildout and actually exchanged between companies, totaling roughly $46B. Next are the purchase commitments that are pretty much just promises to one another to buy compute, chips, memory, infrastructure, and so on. These are roughly 20x greater at $879B, which tells us the future of this buildout rests on enormous obligations and trust rather than money on hand. So, why does this make people nervous? Because the circularity of all these billions is practically a dog chasing its own tail. Nvidia invests billions into OpenAI, and OpenAI then spends heavily on the very chips Nvidia makes, so the chipmaker is effectively helping fund its own customers. Yes, it’s far more complicated than that, and the only people who truly know what’s going on are those who are a part of these firms. But to me, this looks like interdependence that deserves to be questioned and monitored for the foreseeable future.
The Money Behind the AI Buildout
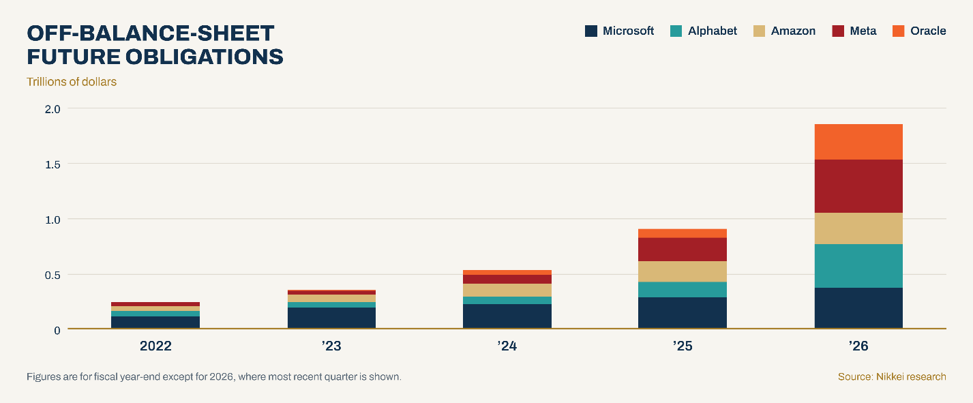
Source: Nikkei Research
Lastly, this chart focuses on the future obligations we talked about earlier, but from the lens of the hyperscalers. What’s astonishing isn’t just the trillions of dollars tied up in these obligations, but the rate of growth from 2022 to 2026, roughly $0.25T to about $1.9T in just four years. And that 2026 figure isn’t even a full year, it reflects only the most recent quarter, yet it’s already by far the largest bar on the chart. I want to reiterate what “off-balance-sheet future obligations” means, because the term sounds more complicated than it is, but what it represents is very real. As the name suggests, these are financial commitments that don’t show up as debt or liabilities on the balance sheet, things like chip supply agreements, power contracts, and data-center leases. Even though these are real obligations where money will be owed, accounting rules let these companies tuck them into the footnotes rather than the balance sheet itself. The effect is that they look far less leveraged than they actually are, and when investors grasp the true scale of these commitments, that’s what rattles confidence. These obligations have to be paid regardless of whether AI monetization shows up, so it’s hard to imagine these companies reversing course. If anything, they’ll keep their foot on the floor.
Sources
- • YCharts (SPY, AGG, IAU as proxies)
- • Baird Strategas, Bloomberg, ETF Action
- • Google Financing Charting
- • JPMorgan
- • Nikkei Research
DISCLOSURE
Past performance is no assurance of future results. Trademark Financial Management, LLC (“Trademark”) is a registered investment adviser with its principal place of business in the State of Minnesota. Trademark and its representatives are in compliance with registration requirements imposed upon investment advisers by those states in which Trademark operates. Trademark may only transact business in those states in which it is registered or qualifies for an exemption or exclusion from registration. This newsletter is limited to the dissemination of general information pertaining to its investment advisory/management services. Any subsequent, direct communication by Trademark with a prospective client shall be conducted by a representative that is either registered or qualifies for an exemption or exclusion from registration in the state where the prospective client resides. A complete list of all recommendations will be provided if requested for the preceding period of not less than one year. It should not be assumed that recommendations made in the future will be profitable or will equal the performance of the securities in this list. Opinions expressed are those of Trademark Financial Management and are subject to change, not guaranteed and should not be considered recommendations to buy or sell any security. For information pertaining to the registration status of Trademark please contact Trademark at (952) 358-3395 or refer to the Investment Adviser Public Disclosure web site (www.adviserinfo.sec.gov). For additional information about Trademark, including fees and services, send for our disclosure statement as set forth on Form ADV from us using the contact information herein or by calling 952-358-3395. Please read the disclosure statement carefully before you invest or send money. Any reference to a chart, graph, formula, or software as a source of analysis used by Trademark Financial Management staff is one of many factors used to make investment decisions for your portfolio. No one graph, chart, formula, or software can in and of itself be used to determine which securities to buy or sell, when to buy or sell them, or assist any person in making decisions as to which securities to buy or sell or when to buy or sell them. Any chart, graph, formula, or software used is limited by the data entered and the created parameters. The data was obtained from third parties deemed by the adviser to be reliable. Nonetheless, the adviser has not verified the results and cannot be assured of their accuracy.