U.S. stocks rose 10.4% in April. The rally was triggered by the March 30th announcement that the U.S. would not invade Iran nor try to obliterate it. Relieved, investors began to buy back stocks and this buying has created its own momentum like in April 2025. The problem is that unlike last year with tariffs, the threat hasn’t really gone away and oil prices (futures) continue to price in a longer conflict. The 30-year Treasury Bond briefly hit 5%. Rising interest rates, rising oil prices and a sustained stock bull market are NOT mutually compatible. I don’t know how or when or from what level this ends (it could be much higher if we have mania tied to the IPOs of SpaceX and a couple major AI players), but I don’t think this year will end with the same 20%-ish gains as the past three years.
Earnings Growth — Strong but Accounting-Driven
Earnings growth has been very strong in the first quarter of 2026. That said, it is important to note that much of the growth is accounting-driven. The OBBBA or One Beautiful Bill accelerates write-offs among other things, as opposed to growth driven by demand volume. First quarter GDP was just reported at a fairly modest 2.0%.
In January I felt that a domestic-to-foreign stock ratio of 69%:31% was appropriate, noting that the dollar was trending weak, foreign markets were less expensive, and capital expenditures were really set to rise in developed markets ex-US. Today, because of the Iran situation and the indefinite blocking of the Straits of Hormuz, I would be more like 72%:28%. There is no getting around the fact that the present situation with respect to the cost of oil is more painful ex-US than it is here. The flip side of this is that if you asked me where I thought I’d be five years from now, I’d have probably said somewhere around 65%-67% US whereas now I’d say 62%-64% U.S. The developed world plus EM Asia will not forget that the U.S. in 2026 made decisions that only favored itself and Israel. (Read also: Our March 2026 Update)
Interest Rates — 30-Year Bond at 5%
It is significant that the 30-year bond is flirting with 5%. It will be even more significant if the 10 years breaches 4.5% and stays above it.
Notable Reads This Month
From Main Street Alpha “We are transitioning from a globalist, low-inflation environment, where tech multiples could expand to the moon on the back of zero-interest-rate policy to a nationalist, high-nominal growth era. If the regime is shifting toward nominal growth and persistent inflation, the biggest winners won’t be the innovators. The biggest winners will be… the monopolistic.”
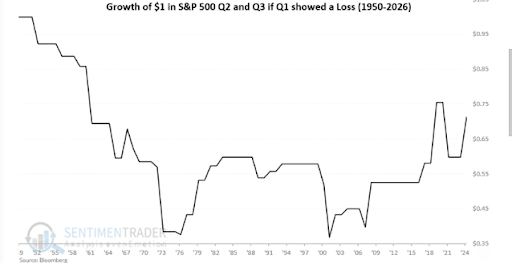
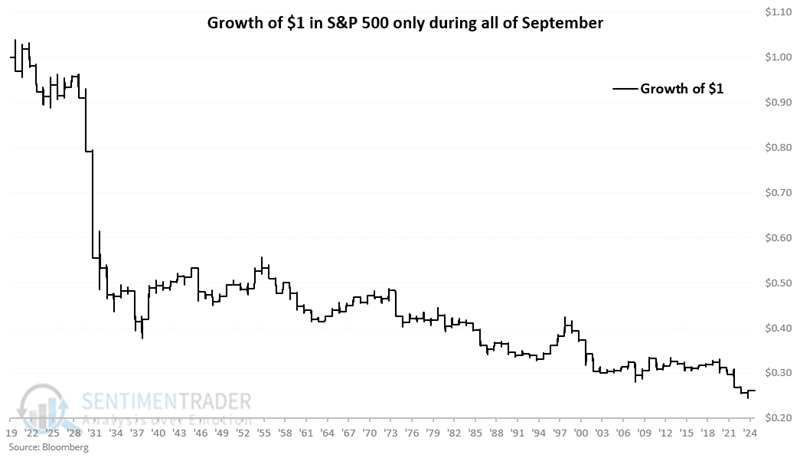
From Sentimentrader: Since 1950, the stock market has shown a collective loss in the middle of the year (April 1-September 30), though it has improved lately
From Howard Marks (Oaktree) on the value of being consistently above average: “I had dinner with the CIO of a pension fund. He explained that in his 14 years on the job, his fund had never been above the 27th percentile or below the 47th percentile. It was solidly in the second quartile of pension funds. As a result, for 14 years, he was in the fourth percentile”.
From Roy Amara on why new technologies are often priced wrong: “people tend to overestimate the short-term impact of new technologies while underestimating their long-term effects.”
From Ford CEO Jim Farley via Cedar Owl: “We cannot fill 5,000 mechanic jobs even at $120,000 per year”. This is not a wage problem. It is a structural training and cultural problem that cannot be solved by tariffs or subsidies.
DISCLOSURE
Past performance is no assurance of future results. Trademark Financial Management, LLC (“Trademark”) is a registered investment adviser with its principal place of business in the State of Minnesota. Trademark and its representatives are in compliance with registration requirements imposed upon investment advisers by those states in which Trademark operates. Trademark may only transact business in those states in which it is registered or qualifies for an exemption or exclusion from registration. This newsletter is limited to the dissemination of general information pertaining to its investment advisory/management services. Any subsequent, direct communication by Trademark with a prospective client shall be conducted by a representative that is either registered or qualifies for an exemption or exclusion from registration in the state where the prospective client resides. A complete list of all recommendations will be provided if requested for the preceding period of not less than one year. It should not be assumed that recommendations made in the future will be profitable or will equal the performance of the securities in this list. Opinions expressed are those of Trademark Financial Management and are subject to change, not guaranteed and should not be considered recommendations to buy or sell any security. For information pertaining to the registration status of Trademark please contact Trademark at (952) 358-3395 or refer to the Investment Adviser Public Disclosure web site (www.adviserinfo.sec.gov). For additional information about Trademark, including fees and services, send for our disclosure statement as set forth on Form ADV from us using the contact information herein or by calling 952-358-3395. Please read the disclosure statement carefully before you invest or send money. Any reference to a chart, graph, formula, or software as a source of analysis used by Trademark Financial Management staff is one of many factors used to make investment decisions for your portfolio. No one graph, chart, formula, or software can in and of itself be used to determine which securities to buy or sell, when to buy or sell them, or assist any person in making decisions as to which securities to buy or sell or when to buy or sell them. Any chart, graph, formula, or software used is limited by the data entered and the created parameters. The data was obtained from third parties deemed by the adviser to be reliable. Nonetheless, the adviser has not verified the results and cannot be assured of their accuracy.
End of February Market Update
This may be the biggest AI month in terms of impact that we’ve had so far. Markets had priced in winners before, but in February 2026 they finally got around to thinking about who would be the losers. And they decided that the companies that provide software as a service, the financial companies that lent money to those SaaS firms, and the employees who work at those firms would be the losers. Once you start thinking about losers, it’s a short jump to thinking about the potential contractionary effects of AI, and you start to warm up to the idea that interest rates might fall. Ten-year bond yields plunged to a four-month low of 3.96% while mortgage rates finally went under 6%. All that on a day where producer price inflation spiked upward. Economic fear is starting to trump inflation concern. That means stocks and bonds will move in the opposite direction.
Investors should also be aware that quality is winning in the bond market right now. Yield spreads are modestly widening as investors get nervous about the lowest quality credits. Private credit, which is basically low quality (BB-CC) credit, has had a couple of nasty days this week in the wake of the default of a British mortgage originator and the run on Blue Owl assets. Financial company stocks got pummeled this week. We are all in the position now of hoping that the current difficulties are isolated and not symptomatic of a much larger credit problem (a la 2008).
We now have to look at the stock market with more nuance. The trade from November through January was to sell technology/large cap growth and buy value/small cap/international. As we discovered this past week, however – financials (banks, insurance companies, global asset managers) are generally found in value funds, and they were easily the worst performers. As for small caps, they had a nice rally early in the year as money came out of the Mag 7 and tax loss selling dried up, but they peaked on January 22. They are now down more than 3% from those highs. Only international stocks are continuing to reward the money that has come out of large U.S. tech stocks.
Beyond that, the precious metals trade continues to work. Unless you bought gold at the top of the spike (January 28th and 29th) you have a profit. Mining stocks have actually surpassed their end-of-January highs because profits margins are so high with gold near $5200/oz. Silver had a much bigger spike and a much more severe fall, so while it was up in February it is well below its January high. Copper and oil continue their sharp 2026 ascent as each are important components to the AI build out.
So the bottom line is be careful. The bond market thinks that the average consumer is weak, aggregate metrics notwithstanding, and that interest rates are going to surprise to the downside. The stock market thinks that interest rates are going lower even though inflation is still in the 3% range because of weakening labor, and it is expressing its fear of “debasement” in terms of buying gold and silver. Other industrial metals are gaining on the “we need more power” trade.
DISCLOSURE
Past performance is no assurance of future results. Trademark Financial Management, LLC (“Trademark”) is a registered investment adviser with its principal place of business in the State of Minnesota. Trademark and its representatives are in compliance with registration requirements imposed upon investment advisers by those states in which Trademark operates. Trademark may only transact business in those states in which it is registered or qualifies for an exemption or exclusion from registration. This newsletter is limited to the dissemination of general information pertaining to its investment advisory/management services. Any subsequent, direct communication by Trademark with a prospective client shall be conducted by a representative that is either registered or qualifies for an exemption or exclusion from registration in the state where the prospective client resides. A complete list of all recommendations will be provided if requested for the preceding period of not less than one year. It should not be assumed that recommendations made in the future will be profitable or will equal the performance of the securities in this list. Opinions expressed are those of Trademark Financial Management and are subject to change, not guaranteed and should not be considered recommendations to buy or sell any security. For information pertaining to the registration status of Trademark please contact Trademark at (952) 358-3395 or refer to the Investment Adviser Public Disclosure web site (www.adviserinfo.sec.gov).
For additional information about Trademark, including fees and services, send for our disclosure statement as set forth on Form ADV from us using the contact information herein or by calling 952-358-3395. Please read the disclosure statement carefully before you invest or send money. Any reference to a chart, graph, formula, or software as a source of analysis used by Trademark Financial Management staff is one of many factors used to make investment decisions for your portfolio. No one graph, chart, formula, or software can in and of itself be used to determine which securities to buy or sell, when to buy or sell them, or assist any person in making decisions as to which securities to buy or sell or when to buy or sell them. Any chart, graph, formula, or software used is limited by the data entered and the created parameters. The data was obtained from third parties deemed by the adviser to be reliable. Nonetheless, the adviser has not verified the results and cannot be assured of their accuracy.
Summary
U.S. stocks added another 2.6% last quarter, bringing its full year return to 17%.1 It was a rather subdued quarter compared to the previous three quarters, and once again international stocks performed substantially better. Investors felt a little more cautious about technology stocks last quarter as concerns grew as to whether the hundreds of billions being spent on artificial intelligence (AI) would have the kind of payoff that big tech stock prices implied. As the focus shifted to industries that would benefit from AI (versus those that were producing it), health care emerged as a winner. Utilities and real estate continued to struggle because both sectors are seen as beneficiaries of lower long-term interest rates. While the Federal Reserve cut short rates twice, this did not do much to lower mortgage rates.2 Investors are trying to figure out the economy in which profits are rising quite nicely but this isn’t leading to more job creation.3
For several years we have been saying that international stocks are cheaper, but until this past year that really didn’t matter. For U.S. investors, the strength of the dollar tended to cancel out much of the gains foreign markets made in the local currency. Last year both factors needed to produce better foreign stock returns occurred; the dollar fell against most foreign currencies and local market stock performance was strong enough to close some of that huge fifteen-year performance gap. Overall, foreign stocks rose 3.8% last quarter and 33.1% for the full year.4 Brazil, South Korea, Taiwan, Germany and Canada all rose more than twice our 17% gain; India was the real laggard amongst major markets last year.
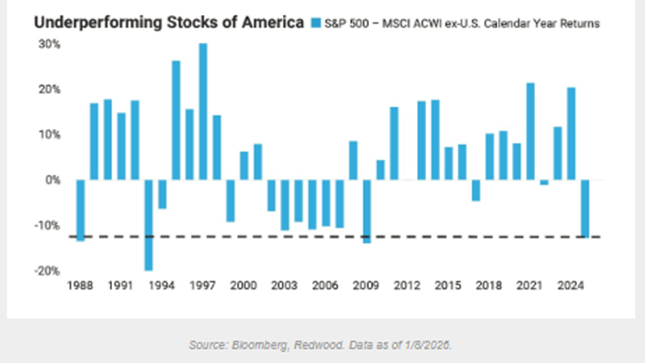
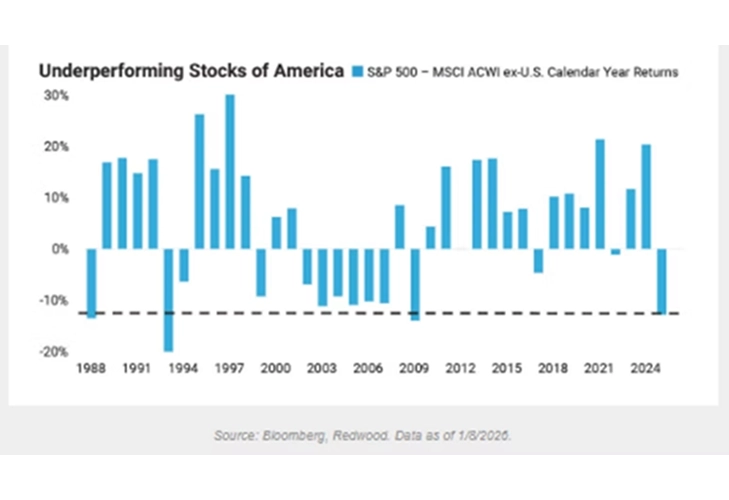
The U.S. stock market had a great run against foreign markets for dollar-based investors, but it looks like it may be over. Relative investment performance is a metric that tends to trend, and the trend appears to have reversed.
Bonds rose 1.2% during the quarter to end the year up 7.2%. This was the first year since 2020 that investors weren’t better off in short maturity bonds. There was optimism about long term rates coming down in September and October, but that had dissipated by December. The biggest profits on the bond side were in emerging market bonds, which rose about 3% last quarter and 14% for the year. Money market returns were over 4.2% last year, but their annualized rate slipped under 4% by the end of the year.
Commodities were the strongest area of the market last year, specifically the metals sector. Industrial metals rose 15.8% last quarter on increased demand for copper and aluminum for constructions. Precious metals rose 15.6% last quarter and 68% for the year due to unprecedented demand for both gold and silver, having mostly to do with global political instability. Crypto- currency had made some inroads in terms of replacing gold in recent years, but bitcoin’s small loss in 2025 showed that when you really need an alternative to the U.S dollar, only gold will do.
Activity
We reallocated portfolios in late September and October because we felt that the market had successfully navigated the seasonally weak late August through late September period without incident and would reward more aggressive positions to the end of the year. We did not get the kind of “Santa Claus rally” that you get in some years. Defensive industries (utilities, real estate) did underperform those that are more economically sensitive (industrials, transportation), with the exception of health care. We also worked hard from Thanksgiving to the end of the year to minimize capital gains. Since stocks rose by 17% and bonds increased by 7%, there simply weren’t enough losses to offset those gains, so we did our best with what was available. I guess lack of losses is a good problem to have. The other issue we encountered was the rapid increase in the price of gold. We established a 2% position in portfolios many years ago for those occasional periods of instability. It seemed like all of 2025 was a period of instability, and those 2% gold positions become 3-4%. We have been taking profits into strength, with our feeling now that gold should not exceed 3% to 3.5%. At some point that degree of volatility can work against you.
Outlook
Any advisor will tell you that there is never any shortage of opinions about where the market is headed. At the beginning of any year, every major investment firm has a webinar in which they give you their prediction for the year. If they are a product shop (i.e. they sell investments), the predictions will almost certainly be bullish on both stocks and bonds. On the other hand, if they sell research or analytics, they are often overly pessimistic because they feel that negativity makes them seem smarter. We are making no prediction about investment returns this year because we just see too many wild cards out there. Not least of these is the geopolitical and economic objectives of the United States, which seem to change on a weekly basis.
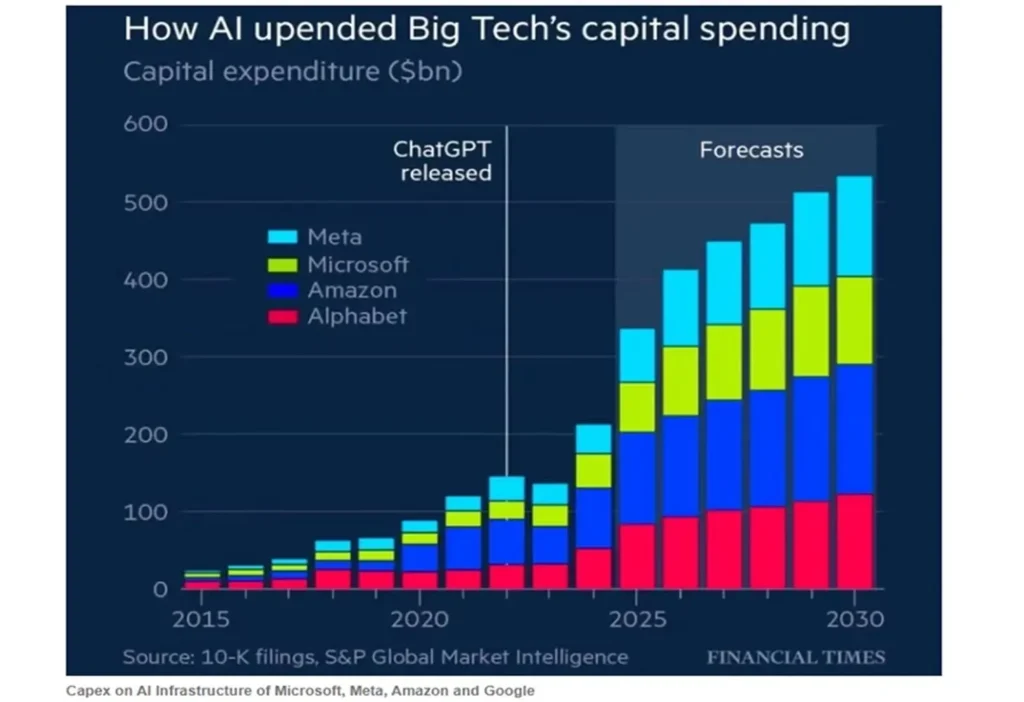
Aside from that, AI spending and future revenues are the biggest unknowns in the market right now. AI is already being used widely in industry to boost productivity, but there is no “killer app” yet. Access to AI at this point is free for writing and editing purposes and is available at a reasonable subscription price for larger entities. That said, it has not reached the “I’ve got to have it whatever it costs” stage that binds you to it and gives providers a large, growing, and reliable income stream.5 This could be a problem because many technology and related stocks are priced on the assumption that the high margin application stage will be reached. Even if AI becomes essential, it’s uncertain whether we could produce enough electricity to power all of the things we expect it to do. So, in a sense we are building the proverbial bridge as we are crossing it.
If this chart is true, then the big technology hyper-scalers will be spending so much money building out their AI programs that they won’t be able to afford much in the way of dividend increases or share buybacks. Stock prices have already begun to reflect concern.
On the positive side, some parts of the market (small caps, emerging markets) that haven’t moved much over the past ten years (and are therefore reasonably priced) have been doing well lately. If there is widespread disappointment with technology profitability, money will probably rotate into other sectors as long as the general economy holds up. Interest rates are the key. If the ten-year note can stay around 4%, we’ll probably be okay this year.
Commentary – Random Thoughts
In the absence of one unifying theme for this commentary, I’d like to present a few quotes and ideas and charts that have interested me lately.
Michael Cembalest is an investment strategist for J.P. Morgan whose research and ideas are “must reading” among financial professional these days. A lot of what I know about the opportunities and challenges of AI are from his writings. There are two things he has written recently that I have noted:
1. “US technology price-to-earnings-growth ratios are only 1-3 times in recent years. In the dot.com era stock prices were 4-8 times expected annual earnings growth”.6 In other words, we have not maxed out at all what investors might pay at the top of the cycle.
2. “After a correction, ask “what could go right” rather than obsessing over factors that led to the selloff. And when markets are highly concentrated and near all-time highs, the right question to ask is “what could go wrong”.7 He is saying that there aren’t enough people thinking today about what might go wrong because every sell-off since 2011 has been an opportunity to buy. At some point, the market will cry wolf and there really will be a wolf.
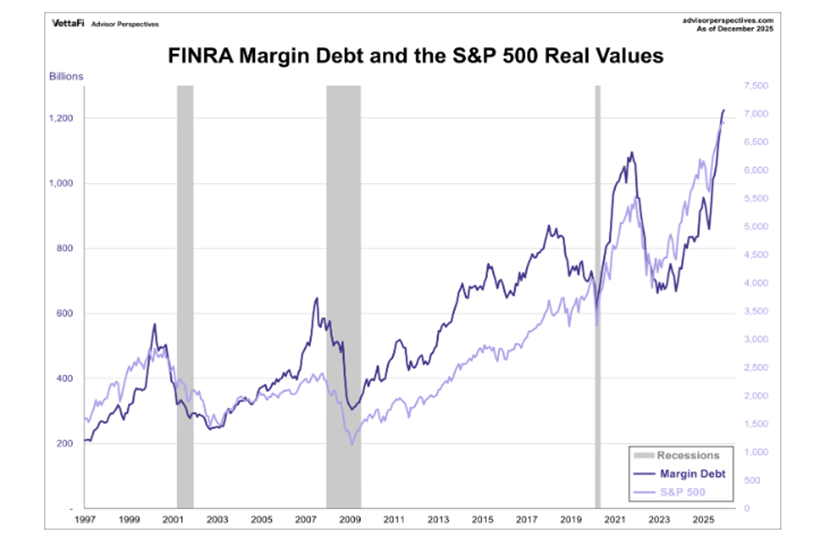
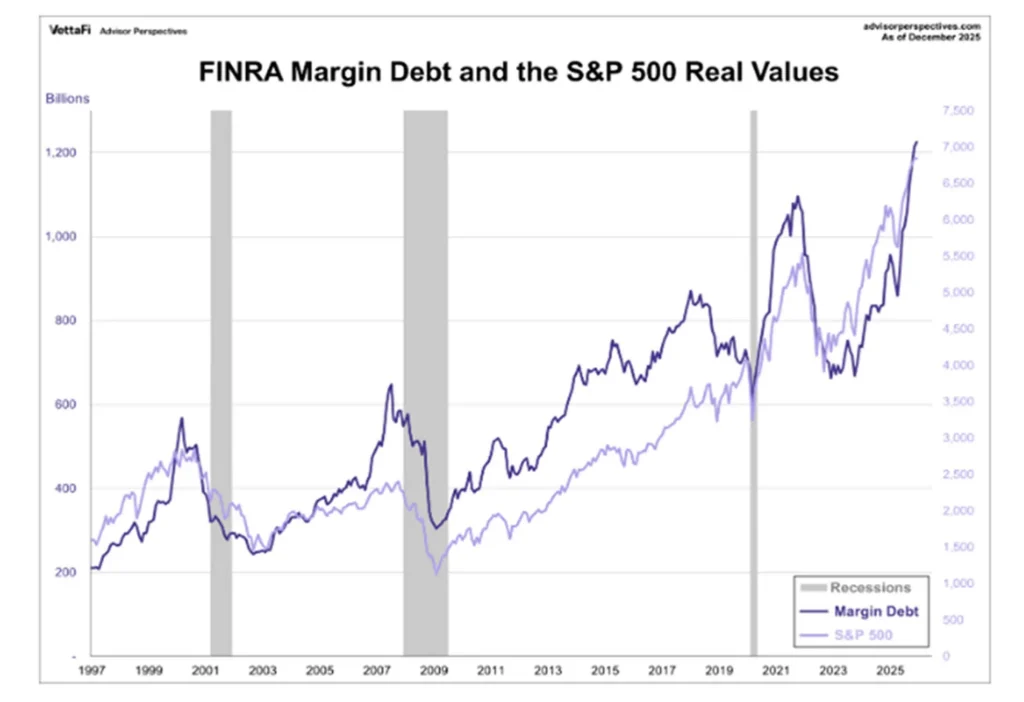
Margin Debt is a measure of how aggressive (leveraged) stock market investors are in aggregate. As you can see, we are at all-time highs. This doesn’t mean we can’t go higher, but it does suggest that the current advance is pretty far extended. When this measure starts to fall, often a recession is not far behind.
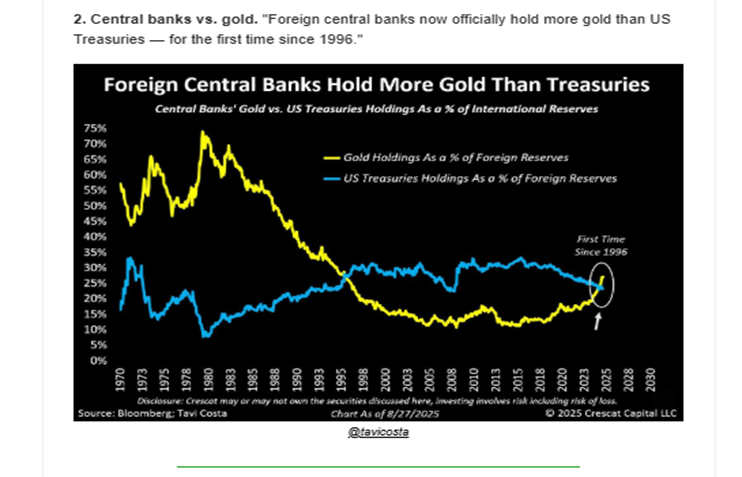
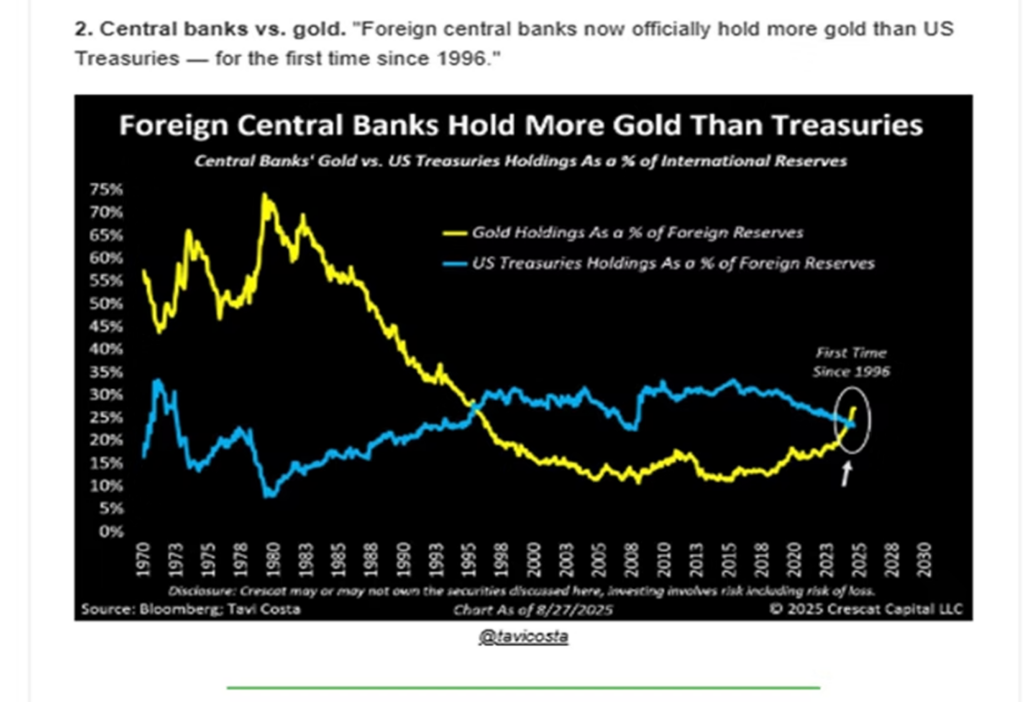
One of the reasons for the big surge in gold prices is the surge is buying by foreign central banks. Why have they been buying gold and selling their U.S. Treasuries? Every country has its own reasons, but China has been trying to diversify away from the dollar since the mid-2010s when the trade war with the U.S. intensified. The sharp move in recent years has to do with widespread fears that the U.S. might seek to punish any country that did not fall in line behind it, much as it punished Russia economically after the Ukraine invasion and Iran before that.
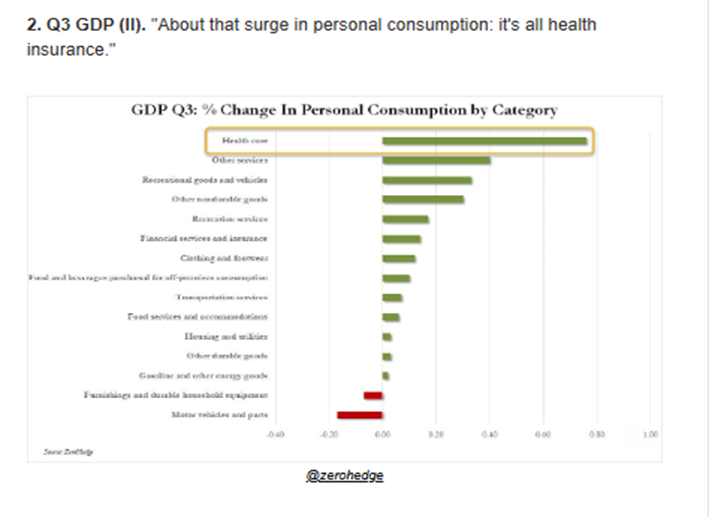
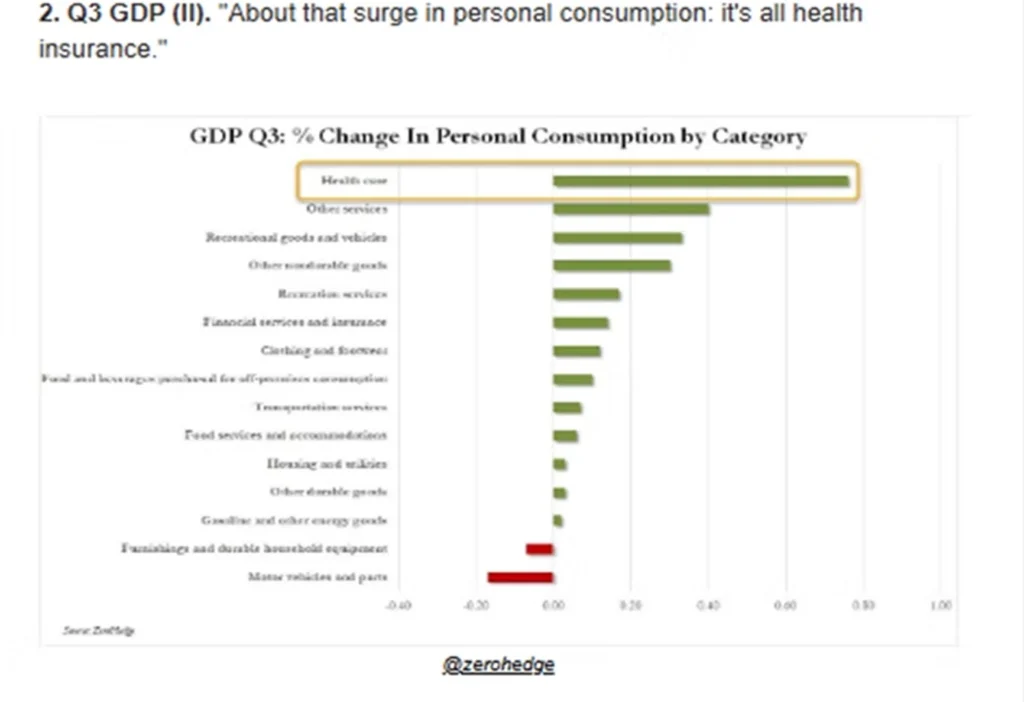
The economy was not as strong last year as it appeared. Largely, GDP rose because we spent more for health insurance.
[1] S&P 1500 U.S. Stock Composite, via Standard & Poors. ↩︎
[2] Because mortgages tend to be tied to it, the ten-year U.S. Treasury is seen as the key to the housing sector. ↩︎
[3] Except in health care, but those are primarily lower wage jobs tied to taking care of senior citizens. ↩︎
[4] JPMorgan Asset Management, Guide to the Market 1Q26. In U.S. dollar terms. ↩︎
[5] Like the iPhone, for instance, or Google. You could use a different phone or search engine, but the network effects of both of these was overwhelmingly powerful. ↩︎
[6] Michael Cembalest, JP Morgan – Eye on the Market ↩︎
[7] Michael Cembalest, JP Morgan – Eye on the Market ↩︎
DISCLOSURE
Past performance is no assurance of future results. Trademark Financial Management, LLC (“Trademark”) is a registered investment adviser with its principal place of business in the State of Minnesota. Trademark and its representatives are in compliance with registration requirements imposed upon investment advisers by those states in which Trademark operates. Trademark may only transact business in those states in which it is registered or qualifies for an exemption or exclusion from registration. This newsletter is limited to the dissemination of general information pertaining to its investment advisory/management services. Any subsequent, direct communication by Trademark with a prospective client shall be conducted by a representative that is either registered or qualifies for an exemption or exclusion from registration in the state where the prospective client resides. A complete list of all recommendations will be provided if requested for the preceding period of not less than one year. It should not be assumed that recommendations made in the future will be profitable or will equal the performance of the securities in this list. Opinions expressed are those of Trademark Financial Management and are subject to change, not guaranteed and should not be considered recommendations to buy or sell any security. For information pertaining to the registration status of Trademark please contact Trademark at (952) 358-3395 or refer to the Investment Adviser Public Disclosure web site (www.adviserinfo.sec.gov). For additional information about Trademark, including fees and services, send for our disclosure statement as set forth on Form ADV from us using the contact information herein or by calling 952-358-3395. Please read the disclosure statement carefully before you invest or send money. Any reference to a chart, graph, formula, or software as a source of analysis used by Trademark Financial Management staff is one of many factors used to make investment decisions for your portfolio. No one graph, chart, formula, or software can in and of itself be used to determine which securities to buy or sell, when to buy or sell them, or assist any person in making decisions as to which securities to buy or sell or when to buy or sell them. Any chart, graph, formula, or software used is limited by the data entered and the created parameters. The data was obtained from third parties deemed by the adviser to be reliable. Nonetheless, the adviser has not verified the results and cannot be assured of their accuracy.
End of November Market Update
1. The top story in November was the surge in both gold and silver. Gold is up 60.3% year-to-date and 9% so far this quarter, while silver’s gains are 94.6% and 22%. There are many theories as to why precious metals have performed so well this year. Dollar weakness might have explained the first half surge, but the dollar has been up since June. Significant concerns about U.S. monetary policy once Federal Reserve Chairman Jerome Powell is gone is probably the biggest contributor to the precious metals surge this quarter.
2. The S&P 500 recovered in the last week of the quarter to post a very modest 0.1% monthly gain. This was its seventh consecutive monthly gain. Almost certainly the streak would have ended without the thin trading conditions the day before and after Thanksgiving. We will probably give that back on December 1st (at least, that has been the pattern). I bring this up because I feel that the U.S. stock market is tired. Typically, there is a correction in September that provides the fuel for an end-of-year rally. We didn’t get that this year. The only catalyst the market seems to have right now is the growing prospect of a Fed easing on December 10th.
3. High yield bonds, which can be a canary in the coal mine in terms of giving advance warning of an economic downturn, have been underperforming so far this quarter. I’m keeping an eye on this in the wake of the well-publicized collapse of two entities heavily funded by private credit. I want to see if there are more “cockroaches” to be discovered. The market has become cautious, but not fearful in this area.
4. Healthcare was by far the biggest sector winner in November. It is thought that investors are catching on to the myriad benefits of AI to the health care sector in terms of drug discovery and targeted treatment. That said, technical indicators suggest it may be overbought in the short term (RS reached 76 on Tuesday). By and large this is not an expensive sector (Eli Lilly notwithstanding), so I believe it can be an outperformer into 2026.
5. Bitcoin has been struggling mightily this quarter. Having topped $127,000 on October 6th, it is below $90,000 today. I look at bitcoin as a proxy on speculation/excess liquidity in the market, and clearly that kind of activity has been in sharp decline lately. For this reason, I am not overly optimistic on the technology sector in the near terms – tech and bitcoin tend to have a high positive correlation.
6. The Russell 2000 is up 2.6% this quarter. That compares favorably to a 2.4% gain for the S&P 500. It does not signal, however, a breakout in small cap stocks. Small cap bulls can claim a 2% performance advantage since November 14, but expanding the chart out to look at a 12 or 24 month perspective does no favors for small caps – lower relative highs and lower lows. I’d LOVE for this to change. We would certainly benefit from diversification bearing more fruit, but the charts don’t show anything more than a periodic uptick so far.
7. For the most part, foreign stocks have tracked the 2.5% gain in U.S. stocks quarter-to-date. Latin America has been the best performing region. Performance has generally favored large value-oriented funds overseas. The Asia tech trade, which was strong all summer, was especially weak in November.
DISCLOSURE
Past performance is no assurance of future results. Trademark Financial Management, LLC (“Trademark”) is a registered investment adviser with its principal place of business in the State of Minnesota. Trademark and its representatives are in compliance with registration requirements imposed upon investment advisers by those states in which Trademark operates. Trademark may only transact business in those states in which it is registered or qualifies for an exemption or exclusion from registration. This newsletter is limited to the dissemination of general information pertaining to its investment advisory/management services. Any subsequent, direct communication by Trademark with a prospective client shall be conducted by a representative that is either registered or qualifies for an exemption or exclusion from registration in the state where the prospective client resides. A complete list of all recommendations will be provided if requested for the preceding period of not less than one year. It should not be assumed that recommendations made in the future will be profitable or will equal the performance of the securities in this list. Opinions expressed are those of Trademark Financial Management and are subject to change, not guaranteed and should not be considered recommendations to buy or sell any security. For information pertaining to the registration status of Trademark please contact Trademark at (952) 358-3395 or refer to the Investment Adviser Public Disclosure web site (www.adviserinfo.sec.gov).
For additional information about Trademark, including fees and services, send for our disclosure statement as set forth on Form ADV from us using the contact information herein or by calling 952-358-3395. Please read the disclosure statement carefully before you invest or send money. Any reference to a chart, graph, formula, or software as a source of analysis used by Trademark Financial Management staff is one of many factors used to make investment decisions for your portfolio. No one graph, chart, formula, or software can in and of itself be used to determine which securities to buy or sell, when to buy or sell them, or assist any person in making decisions as to which securities to buy or sell or when to buy or sell them. Any chart, graph, formula, or software used is limited by the data entered and the created parameters. The data was obtained from third parties deemed by the adviser to be reliable. Nonetheless, the adviser has not verified the results and cannot be assured of their accuracy.
Summary
U.S. stocks added another 2.6% last quarter, bringing its full year return to 17%.1 It was a rather subdued quarter compared to the previous three quarters, and once again international stocks performed substantially better. Investors felt a little more cautious about technology stocks last quarter as concerns grew as to whether the hundreds of billions being spent on artificial intelligence (AI) would have the kind of payoff that big tech stock prices implied. As the focus shifted to industries that would benefit from AI (versus those that were producing it), health care emerged as a winner. Utilities and real estate continued to struggle because both sectors are seen as beneficiaries of lower long-term interest rates. While the Federal Reserve cut short rates twice, this did not do much to lower mortgage rates2. Investors are trying to figure out the economy in which profits are rising quite nicely but this isn’t leading to more job creation.3
For several years we have been saying that international stocks are cheaper, but until this past year that really didn’t matter. For U.S. investors, the strength of the dollar tended to cancel out much of the gains foreign markets made in the local currency. Last year both factors needed to produce better foreign stock returns occurred; the dollar fell against most foreign currencies and local market stock performance was strong enough to close some of that huge fifteen-year performance gap. Overall, foreign stocks rose 3.8% last quarter and 33.1% for the full year.4 Brazil, South Korea, Taiwan, Germany and Canada all rose more than twice our 17% gain; India was the real laggard amongst major markets last year.
The U.S. stock market had a great run against foreign markets for dollar-based investors, but it looks like it may be over. Relative investment performance is a metric that tends to trend, and the trend appears to have reversed.
Bonds rose 1.2% during the quarter to end the year up 7.2%. This was the first year since 2020 that investors weren’t better off in short maturity bonds. There was optimism about long term rates coming down in September and October, but that had dissipated by December. The biggest profits on the bond side were in emerging market bonds, which rose about 3% last quarter and 14% for the year. Money market returns were over 4.2% last year, but their annualized rate slipped under 4% by the end of the year.
Commodities were the strongest area of the market last year, specifically the metals sector. Industrial metals rose 15.8% last quarter on increased demand for copper and aluminum for constructions. Precious metals rose 15.6% last quarter and 68% for the year due to unprecedented demand for both gold and silver, having mostly to do with global political instability. Crypto- currency had made some inroads in terms of replacing gold in recent years, but bitcoin’s small loss in 2025 showed that when you really need an alternative to the U.S dollar, only gold will do.
Activity
We reallocated portfolios in late September and October because we felt that the market had successfully navigated the seasonally weak late August through late September period without incident and would reward more aggressive positions to the end of the year. We did not get the kind of “Santa Claus rally” that you get in some years. Defensive industries (utilities, real estate) did underperform those that are more economically sensitive (industrials, transportation), with the exception of health care. We also worked hard from Thanksgiving to the end of the year to minimize capital gains. Since stocks rose by 17% and bonds increased by 7%, there simply weren’t enough losses to offset those gains, so we did our best with what was available. I guess lack of losses is a good problem to have. The other issue we encountered was the rapid increase in the price of gold. We established a 2% position in portfolios many years ago for those occasional periods of instability. It seemed like all of 2025 was a period of instability, and those 2% gold positions become 3-4%. We have been taking profits into strength, with our feeling now that gold should not exceed 3% to 3.5%. At some point that degree of volatility can work against you.
Outlook
Any advisor will tell you that there is never any shortage of opinions about where the market is headed. At the beginning of any year, every major investment firm has a webinar in which they give you their prediction for the year. If they are a product shop (i.e. they sell investments), the predictions will almost certainly be bullish on both stocks and bonds. On the other hand, if they sell research or analytics, they are often overly pessimistic because they feel that negativity makes them seem smarter. We are making no prediction about investment returns this year because we just see too many wild cards out there. Not least of these is the geopolitical and economic objectives of the United States, which seem to change on a weekly basis.
Aside from that, AI spending and future revenues are the biggest unknowns in the market right now. AI is already being used widely in industry to boost productivity, but there is no “killer app” yet. Access to AI at this point is free for writing and editing purposes and is available at a reasonable subscription price for larger entities. That said, it has not reached the “I’ve got to have it whatever it costs” stage that binds you to it and gives providers a large, growing, and reliable income stream.5 This could be a problem because many technology and related stocks are priced on the assumption that the high margin application stage will be reached. Even if AI becomes essential, it’s uncertain whether we could produce enough electricity to power all of the things we expect it to do. So, in a sense we are building the proverbial bridge as we are crossing it.
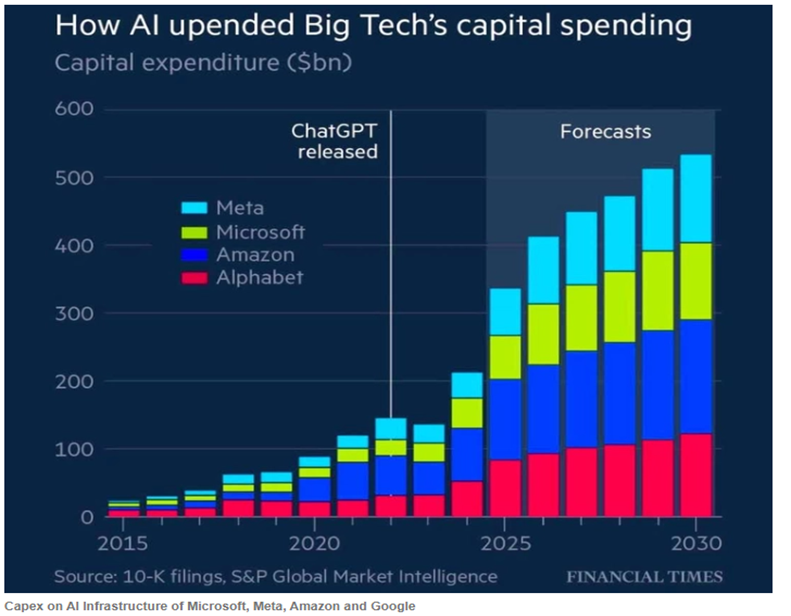
If this chart is true, then the big technology hyper-scalers will be spending so much money building out their AI programs that they won’t be able to afford much in the way of dividend increases or share buybacks. Stock prices have already begun to reflect concern.
On the positive side, some parts of the market (small caps, emerging markets) that haven’t moved much over the past ten years (and are therefore reasonably priced) have been doing well lately. If there is widespread disappointment with technology profitability, money will probably rotate into other sectors as long as the general economy holds up. Interest rates are the key. If the ten-year note can stay around 4%, we’ll probably be okay this year.
Commentary – Random Thoughts
In the absence of one unifying theme for this commentary, I’d like to present a few quotes and ideas and charts that have interested me lately.
Michael Cembalest is an investment strategist for J.P. Morgan whose research and ideas are “must reading” among financial professional these days. A lot of what I know about the opportunities and challenges of AI are from his writings. There are two things he has written recently that I have noted:
1. “US technology price-to-earnings-growth ratios are only 1-3 times in recent years. In the dot.com era stock prices were 4-8 times expected annual earnings growth”.6 In other words, we have not maxed out at all what investors might pay at the top of the cycle.
2. “After a correction, ask “what could go right” rather than obsessing over factors that led to the selloff. And when markets are highly concentrated and near all-time highs, the right question to ask is “what could go wrong”.7 He is saying that there aren’t enough people thinking today about what might go wrong because every sell-off since 2011 has been an opportunity to buy. At some point, the market will cry wolf and there really will be a wolf.
Margin Debt is a measure of how aggressive (leveraged) stock market investors are in aggregate. As you can see, we are at all-time highs. This doesn’t mean we can’t go higher, but it does suggest that the current advance is pretty far extended. When this measure starts to fall, often a recession is not far behind.
One of the reasons for the big surge in gold prices is the surge is buying by foreign central banks. Why have they been buying gold and selling their U.S. Treasuries? Every country has its own reasons, but China has been trying to diversify away from the dollar since the mid-2010s when the trade war with the U.S. intensified. The sharp move in recent years has to do with widespread fears that the U.S. might seek to punish any country that did not fall in line behind it, much as it punished Russia economically after the Ukraine invasion and Iran before that.
The economy was not as strong last year as it appeared. Largely, GDP rose because we spent more for health insurance.
Diclosure
Past performance is no assurance of future results. Trademark Financial Management, LLC (“Trademark”) is a registered investment adviser with its principal place of business in the State of Minnesota. Trademark and its representatives are in compliance with registration requirements imposed upon investment advisers by those states in which Trademark operates. Trademark may only transact business in those states in which it is registered or qualifies for an exemption or exclusion from registration. This newsletter is limited to the dissemination of general information pertaining to its investment advisory/management services. Any subsequent, direct communication by Trademark with a prospective client shall be conducted by a representative that is either registered or qualifies for an exemption or exclusion from registration in the state where the prospective client resides. A complete list of all recommendations will be provided if requested for the preceding period of not less than one year. It should not be assumed that recommendations made in the future will be profitable or will equal the performance of the securities in this list. Opinions expressed are those of Trademark Financial Management and are subject to change, not guaranteed and should not be considered recommendations to buy or sell any security. For information pertaining to the registration status of Trademark please contact Trademark at (952) 358-3395 or refer to the Investment Adviser Public Disclosure web site (www.adviserinfo.sec.gov).
For additional information about Trademark, including fees and services, send for our disclosure statement as set forth on Form ADV from us using the contact information herein or by calling 952-358-3395. Please read the disclosure statement carefully before you invest or send money. Any reference to a chart, graph, formula, or software as a source of analysis used by Trademark Financial Management staff is one of many factors used to make investment decisions for your portfolio. No one graph, chart, formula, or software can in and of itself be used to determine which securities to buy or sell, when to buy or sell them, or assist any person in making decisions as to which securities to buy or sell or when to buy or sell them. Any chart, graph, formula, or software used is limited by the data entered and the created parameters. The data was obtained from third parties deemed by the adviser to be reliable. Nonetheless, the adviser has not verified the results and cannot be assured of their accuracy.
[2] Because mortgages tend to be tied to it, the ten-year U.S. Treasury is seen as the key to the housing sector. ↩︎
[3] Except in health care, but those are primarily lower wage jobs tied to taking care of senior citizens. ↩︎
[4] JPMorgan Asset Management, Guide to the Market 1Q26. In U.S. dollar terms. ↩︎
[5] Like the iPhone, for instance, or Google. You could use a different phone or search engine, but the network effects of both of these was overwhelmingly powerful. ↩︎
[6] Michael Cembalest, JP Morgan – Eye on the Market ↩︎
[7] Michael Cembalest, JP Morgan – Eye on the Market ↩︎
End of October Market Update
· This was a huge month for biotechnology. Biotech is a very long duration asset (many companies are far from their first profits), so they benefit greatly from lower interest rates.
· This was also a very good month for solar/clean energy. Strangely, this industry tends to move counter-intuitively (meaning not at all like political control would make you think).
· October was also a huge month for semi-conductors, as demand continues to be essentially infinite.
· Infrastructure funds had a good month, as industrial, utility, and materials stocks tied to the AI build-out over-performed.
· The performance advantage of large caps over small caps was big once again, but mid-caps were actually the worst performers.
· Gold set an all-time high mid-month, but dollar strength and profit taking has fueled a 9% plus sell-off since then. For gold mining stocks, the decline is 16%. The gold rally was largely predicated on irresponsible central bank behavior. If Fed Chairman Powell stands up to Trump and doesn’t cut rates in December, alternative currencies (gold and bitcoin) are probably not going to do well.
· The market sectors to have avoided in October: Retail/Discretionary, Energy, Real Estate, and Financials. Worst of the worst: Pipelines, homebuilders, Small Banks, and Insurance.
· Emerging Markets performed very well, led by Argentina (35%, on U.S. financial support) and South Korea (21%, on the agreement to provide Nvidia chips to their technology companies). India finally had a good month.
· Dividend-focused strategies are lagging the market on both a monthly and a yearly basis.
· AI is really hurting business models that depend on selling information. Consulting and business services (Moody’s, Fair Isaac, etc.) have commanded premium multiples for years if not decades, but those multiples are shrinking fast.
· Bonds rallied hard from May 21 (“maybe these tariffs aren’t going to be as inflationary as we thought”) to October 28 (we aren’t seeing much of an economic slowdown despite the shutdown. What if Powell hints that he might not cut in December?”). Bonds have lost about 1% since then, but I’m still inclined to be bullish.
Conclusions:
· I believe gold is a weak holding until the market begins to focus on Powell’s successor, which might not be until March or so (his term ends in May).
· Seasonally the stock market is moving into a stronger period (November-January). Investors tend to buy strength to pad their returns. I see large cap growth continuing to lead, partially because the arguments for defensive industries and smaller companies are just not economically supported.
· Japan, under it’s new Prime Minister, is returning to it’s super easy monetary policy stance. Because of this, the yen is falling and Japanese stocks are rising. More importantly for global investors, the “carry trade” is working again (borrow in Yen, buy global risk assets). As ridiculous as one might find the valuation of a stock like Palantir (300 times next year’s earnings, 142 times sales), this is why you can’t short it now.
DISCLOSURE
Past performance is no assurance of future results. Trademark Financial Management, LLC (“Trademark”) is a registered investment adviser with its principal place of business in the State of Minnesota. Trademark and its representatives are in compliance with registration requirements imposed upon investment advisers by those states in which Trademark operates. Trademark may only transact business in those states in which it is registered or qualifies for an exemption or exclusion from registration. This newsletter is limited to the dissemination of general information pertaining to its investment advisory/management services. Any subsequent, direct communication by Trademark with a prospective client shall be conducted by a representative that is either registered or qualifies for an exemption or exclusion from registration in the state where the prospective client resides. A complete list of all recommendations will be provided if requested for the preceding period of not less than one year. It should not be assumed that recommendations made in the future will be profitable or will equal the performance of the securities in this list. Opinions expressed are those of Trademark Financial Management and are subject to change, not guaranteed and should not be considered recommendations to buy or sell any security. For information pertaining to the registration status of Trademark please contact Trademark at (952) 358-3395 or refer to the Investment Adviser Public Disclosure web site (www.adviserinfo.sec.gov).
For additional information about Trademark, including fees and services, send for our disclosure statement as set forth on Form ADV from us using the contact information herein or by calling 952-358-3395. Please read the disclosure statement carefully before you invest or send money. Any reference to a chart, graph, formula, or software as a source of analysis used by Trademark Financial Management staff is one of many factors used to make investment decisions for your portfolio. No one graph, chart, formula, or software can in and of itself be used to determine which securities to buy or sell, when to buy or sell them, or assist any person in making decisions as to which securities to buy or sell or when to buy or sell them. Any chart, graph, formula, or software used is limited by the data entered and the created parameters. The data was obtained from third parties deemed by the adviser to be reliable. Nonetheless, the adviser has not verified the results and cannot be assured of their accuracy.
Summary
The stock market rally continued, with the S&P 500 adding another 8.1% last quarter to bring its year-to-date gain up to 14.8%. Once again, technology was the leader, as its 13.2% quarterly gain was driven by sky-high aspirations for growth in the artificial intelligence trade(AI) sector. The only declining sector was consumer staples (think Pepsi and Procter & Gamble), which posted a -2.4% loss. The AI boom is mainly lifting technology stocks (especially those that produce the semiconductor chips that power the search for greater intelligence), but it’s also the boosting the utility stocks that provide the power, the real estate stocks that provide the land where data centers are built, the industrial stocks that build the plants and cool them so they don’t overheat, and the financial stocks that raise the money for all of this. There is a certain gold rush mentality in the stock market right now, which is exciting but also increasingly concerning.
Emerging markets outpaced both U.S. stocks and foreign developed markets stocks last quarter. China was especially strong as its government provided significant support to its technology sector. Knowing that cutting-edge semiconductor chips from Nvidia would no longer be available because of trade restrictions, China has gone “all-in” on producing its own. Many of the best performing foreign markets this year have been in the emerging area – Vietnam, South Korea, Poland, and Peru – are each up more than 50%. That’s why you diversify.
Bonds added another two percent last quarter, bringing their year-to-date return to 6.1%. When interest rates started to soar in early 2022, investors found that they were better off in money market funds than in bond funds because the latter was more volatile yet returned less because of inflation. That hasn’t really been the case over the last 12 months; the promise of interest rate cuts has invigorated the bond market as money market yields have fallen. High-yield bonds have risen 7.2% this year, nicer than Treasuries, but maybe not enough extra yield for the added risk. So far this year, global bonds have continued to be the top performers. Emerging market debt rose another 4.3% last quarter and is up close to 11% year-to-date. Municipal bonds have been the weakest sector of the bond market this year, but they finally began to perform in August and finished the quarter up 3.1%.
All the above paled in comparison to the stellar gains from the gold sector. Gold bullion soared 16.4% last quarter due to several factors, including global central bank demand and fears about U.S. interest rates and trade policy. Gold mining stocks, which can be considered leveraged investments tied to gold price movements, experienced a 43.8% increase in the last quarter. Gold is a very volatile sector, so it is essential to make changes incrementally.
Activity
Risk-taking was clearly in fashion last quarter as stocks in select niches like quantum computing, uranium mining, and cryptocurrency staking made large moves. There isn’t much one can do in an environment like this – we are not going to chase stocks in companies that are just starting up and hardly even have revenues (let alone profits). We were more interested in weeding out some underperformers (stock funds that leaned too heavily into real estate, health care, energy, or consumer staples) than making any major changes. Sometimes it pays to buy what is cheap and out of favor, but this past quarter was not such a time. On the bond side, in addition to extending the duration to benefit from declining interest rates, we also reduced floating rate exposure because lower rates mean lower yields.
Outlook
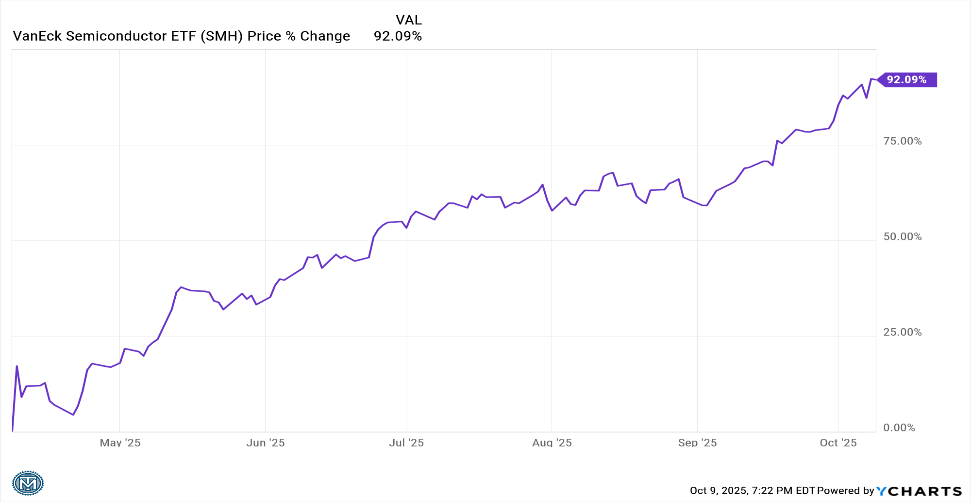
Historically, September is a difficult month for stocks. Market started to anticipate this by flattening out in mid-August, but positive interest rate news sent the market soaring again after Labor Day. I have learned over decades in this business to be nervous when investors get this ebullient, but I know I’m never get the exact timing of a market top. If one leaves the party too early, one can miss a lot. The S&P 500 has provided outstanding returns since 2012, so if one is going to go against the big technology names that lead this index, one better be very sure of both their thesis and their timing (and I am not). I just know that trees don’t grow to the sky. A couple of charts of hot sub-sectors show just how far and how fast we’ve run up:
Semiconductors are up over 92% since April 8th. They are a key component in Artificial Intelligence, but still… 92% in six months?
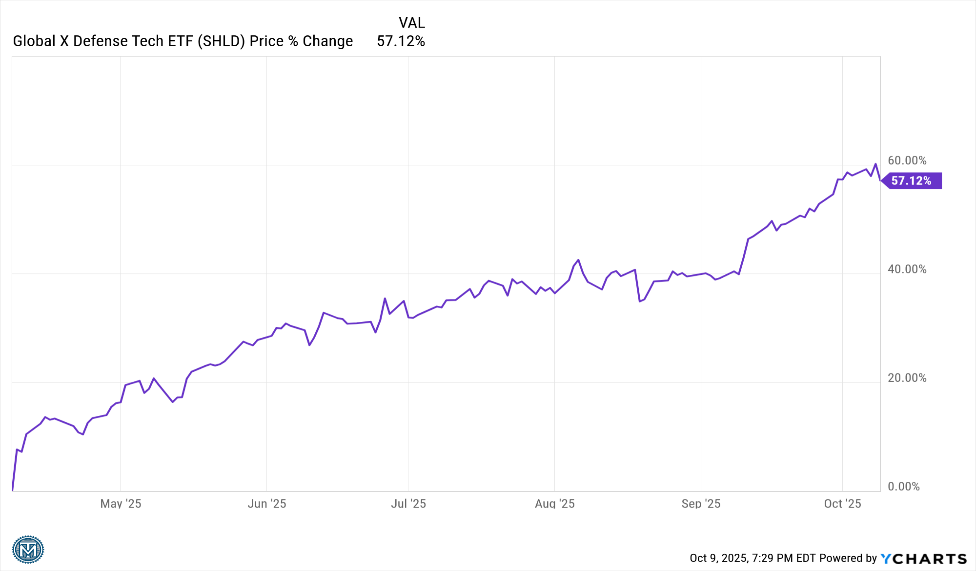
This is the defense technology sector. Up 57% in six months. The charts for gold, coal, copper, uranium, quantum computing, and digital finance and just as strong (if not stronger).
I am not averse to investing in these sectors (we already do, to some extent). In fact, I believe that the two interest rate cuts we expect this year meaningfully reduces the chance that the “tech reckoning” happens in 2025. If this sounds too bearish, remember this: the bursting of the technology bubble in 2000 led to a half-decade of great returns for the small company and financial/real estate sectors because the fallout led to sharp decline in interest rates. I’m starting to become bullish about non-technology sectors. When it comes to the financial markets, someone’s pain is often somebody else’s gain.
Commentary
Since I’ve suggested that technology may not be a leading sector going forward, I owe you a good discussion of why I feel this way. You will recall that last quarter when I described the dramatic outperformance of growth over value in recent years I did not suggest that I saw an imminent end to that.1 The stock market can and often does remain overvalued for prolonged periods of time if liquidity conditions are favorable. If investors don’t get carried away, nice gains can be had for years. However, as happens every so often, investors decided they wanted to discount future earnings all at once. Several years of anticipated AI profits in different areas of the economy were priced in. This is making it exceedingly difficult to justify what is going on without making comparisons to earlier pre-crash periods like 1987 or 1999 or 2021.
Here are my main areas of concern:
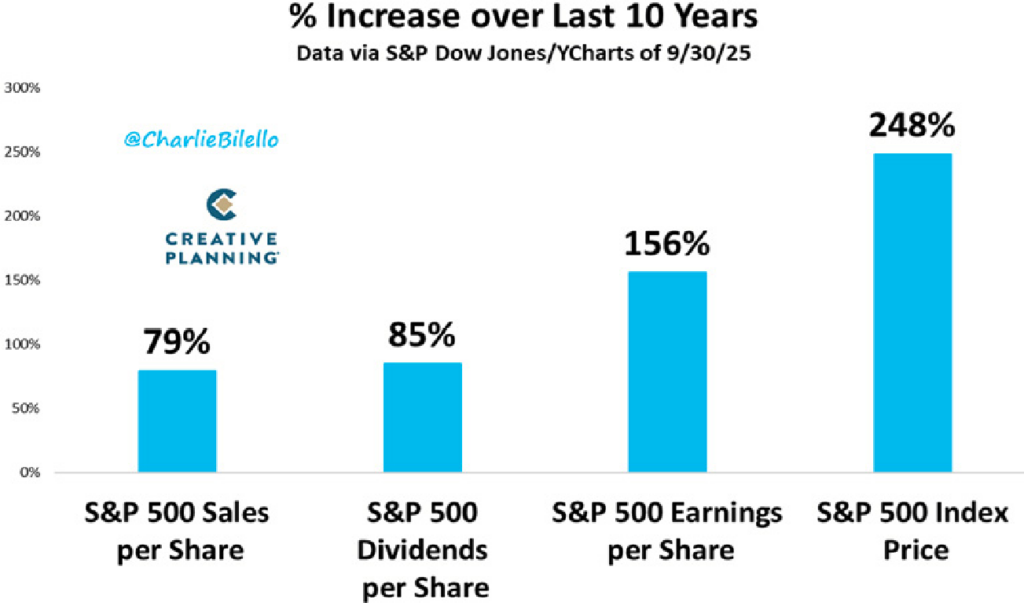
1. Valuation – A Nice Increase in Earnings Growth Has Gone a Long Way
This chart shows how the market is turning modest corporate profit increases into large price gains.
2. Relative Strength – Piling Into Today’s Winners Can Be a Risky Strategy
Relative strength is a measure of how strong the price performance of an asset is versus its peers. Theoretically, one wants to own assets that are over-performing and to avoid those that are under-performing. At a certain level of over- or under-performance, however, the trend is usually unsustainable; nothing soars or plunges forever. The market uses a measure called RSI to determine good over-performance (recognition of competitive advantage) versus dangerous over-performance (assertions that said company “owns the future”). An RSI over 75 suggests the stock or ETF is doing so much better than the overall market that a period of “consolidation” – at the very least – is likely. Wall Street has a maxim: “Pigs get fat, hogs get slaughtered” to warn against feeding too heavily at the trough, so to speak.
3. Increasingly Lower Free Cash Flow – Not All Great Businesses Today Will Be Great Businesses Tomorrow
Investors typically love free cash flow, which is defined as the cash a business has left over after all expenses (including taxes and dividends) are paid, PLUS any spending required to maintain the current level of profitability (in other words, depreciation). The more the hyper-scalers (Meta, Amazon, Microsoft, and Alphabet) are forced to spend just to keep pace in the AI race with their rivals, the less they have for dividends, stock buybacks, or acquisitions.
One of the biggest attractions these stocks had up until recently was that they were huge free cash generators. As such, they commanded price-to-earnings multiples of over 30 times (while for the average stock, the P/E multiple is less than 20). If they continue to have to spend gigantic sums on their AI buildouts, they deserve lower P/E multiples.2 This implies that their current stock prices are too high.
4. Quality – Lower Quality Companies Tend to Outperform Before Market Peaks
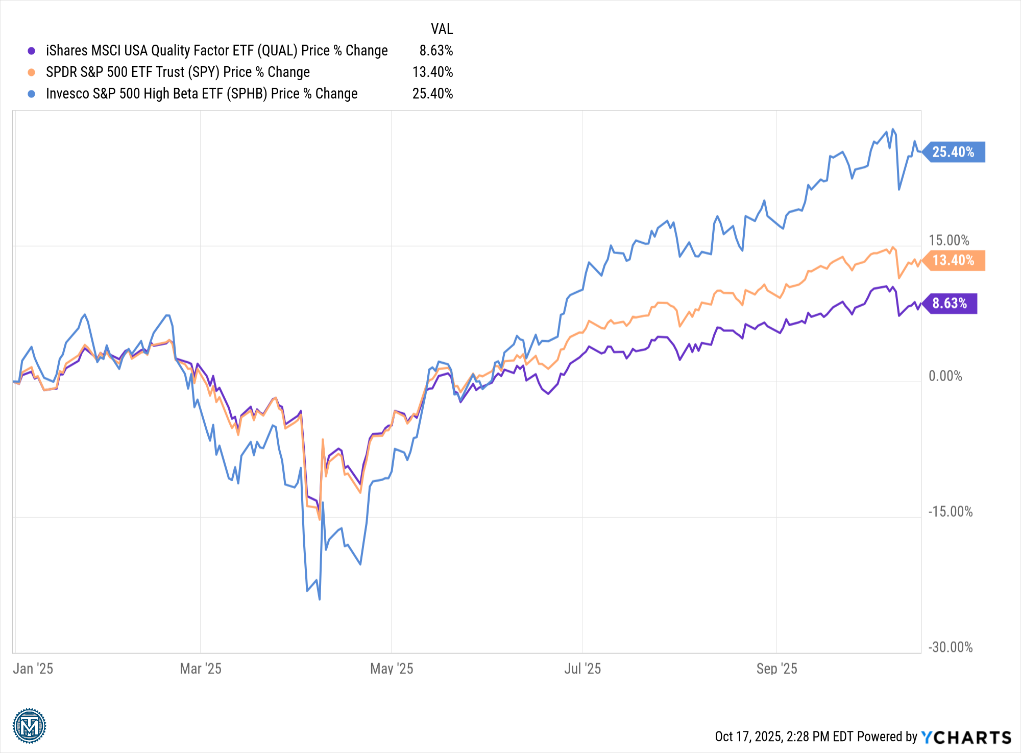
Quality, as a stock attribute, sounds like something you definitely want. It is usually defined as having a strong balance sheet, strong cash flow, and a leading position in a growing industry. Many believe that companies exhibiting these characteristics have better stock performance over time, and they are generally correct. That said, “quality” historically delivers its best performance during downturns (when poorly financed companies with declining cash flows tend to decline much, much more). While no investment manager ever says that they focus on low-quality companies, the fact is that those companies tend to perform better when speculative fever is high. Some of the biggest winners this year are either highly leveraged or very vulnerable to disruption. This has been especially true since June:
The S&P 500 is the orange (middle) line. If you extract just the riskiest companies (blue line) from that index, you earn a much better return. If you factor out the highest quality companies, you would be under-performing
5. Profit Taking Sounds Good, Realization of Taxable Gains Does Not
One of the things that made the bursting of the dot com bubble from 2000-02 so painful was that investors saw their tech portfolios lose 60-85% of their value, AND they had to pay capital gains taxes! Understandably, investors prefer to avoid taxes, so they are disinclined to sell positions that have appreciated significantly in value. What tends to happen, therefore, is that when stock prices begin to fall, investors tend to sell those positions with just modest gains and hold the ones with larger gains. This is called “profit taking”, and it is quite common. However, every decade or two, there is a significant sell-off where investors start to panic and sell more indiscriminately. The big winners tend to become big losers because those stocks and funds that didn’t see much profit-taking in the up years begin to “catch up” on the downside. These stocks have a significantly greater amount of embedded capital gains, so even down 50% or more the tax hit can be very large.
Again, all of this is offered not because I expect the tech sector to go down substantially very soon, but because I know some sort of re-adjustment is almost sure to happen and it might happen soon. We hear a lot about AI these days, but one should understand that large future sales of power, data centers, and semiconductor chips are already priced into most stocks. The kinds of things that I look for to tell me that risks are elevated – high valuations, narrowing market breadth, decreasing free cash flow, low quality leadership – are considerably more prevalent in the technology sector now than they were three months ago, which increases my nervousness. With liquidity conditions positive and interest rates set to be cut twice more this year, I think the odds of something major happing in 2025 aren’t high. I am, however, looking harder than I have in years at finding areas outside of the AI trade to shift assets to.
[2] Additionally, the new budget law recently enacted by Congress (OBBBA) allows a much slower depreciation schedule (6 years instead of 3. This change has given these firms a reported earnings benefit of 7-12% in 2025, according to TenViz. Since the actual chip and server technologies are becoming obsolete faster rather than slower, arguably depreciation schedules should have shortened rather than lengthened. ↩︎
DISCLOSURE
Past performance is no assurance of future results. Trademark Financial Management, LLC (“Trademark”) is a registered investment adviser with its principal place of business in the State of Minnesota. Trademark and its representatives are in compliance with registration requirements imposed upon investment advisers by those states in which Trademark operates. Trademark may only transact business in those states in which it is registered or qualifies for an exemption or exclusion from registration. This newsletter is limited to the dissemination of general information pertaining to its investment advisory/management services. Any subsequent, direct communication by Trademark with a prospective client shall be conducted by a representative that is either registered or qualifies for an exemption or exclusion from registration in the state where the prospective client resides. A complete list of all recommendations will be provided if requested for the preceding period of not less than one year. It should not be assumed that recommendations made in the future will be profitable or will equal the performance of the securities in this list. Opinions expressed are those of Trademark Financial Management and are subject to change, not guaranteed and should not be considered recommendations to buy or sell any security. For information pertaining to the registration status of Trademark please contact Trademark at (952) 358-3395 or refer to the Investment Adviser Public Disclosure web site (www.adviserinfo.sec.gov).
For additional information about Trademark, including fees and services, send for our disclosure statement as set forth on Form ADV from us using the contact information herein or by calling 952-358-3395. Please read the disclosure statement carefully before you invest or send money. Any reference to a chart, graph, formula, or software as a source of analysis used by Trademark Financial Management staff is one of many factors used to make investment decisions for your portfolio. No one graph, chart, formula, or software can in and of itself be used to determine which securities to buy or sell, when to buy or sell them, or assist any person in making decisions as to which securities to buy or sell or when to buy or sell them. Any chart, graph, formula, or software used is limited by the data entered and the created parameters. The data was obtained from third parties deemed by the adviser to be reliable. Nonetheless, the adviser has not verified the results and cannot be assured of their accuracy.
Market Thoughts – August 29, 2025
1. Growth stocks seem a little tired. Give them credit where it is due, they have sizzled over the last few months. However, in the wake of Nvidia’s extremely-solid-but-not-quite-lights-out earnings report and strong-but-not-pound-the-table-strong forward guidance, investors have decided that the tech sector might need to rest for a little while. Secondary tech names are getting crushed when they disappoint, and even some leaders (Microsoft, Meta) are giving back all of their post-earnings gains. Apple was the best performing Mag 7 stock in August because it has tens of billions in cash on hand.
2. Defensive stocks started to catch a bid in August. Speaking of large cash hoards, Berkshire Hathaway had been selling off for three straight months after Chairman Warren Buffett announced that he was stepping down back on May 3rd. It hit a low of $459 on August 4th, off 15% from its May 2 high. It’s up $45 (10%) since then. High free cash flow as a factor, which lagged badly from January through July, was the second-best factor in August (after small size). Even beat-up health care stocks began to catch a bid this month.
3. Every knock against the Federal Reserve as an institution or at individual members of the Fed only serve to make investors nervous about America’s commitment to sound monetary policy. And as result, they buy more gold. Gold bullion gained 4% in August. Gold mining stocks soared 19%, because the price of gold is now so much higher than the cost of mining it. If you are curious, bitcoin fell 7% in August. Whatever it is, bitcoin is not a hedge against financial instability.
4. The dollar declined in August after a very strong July. Not surprisingly, foreign stocks outperformed U.S. stocks in dollar terms. Vietnam was the best performing foreign market (and I think we all can guess why). China was the best larger market, which is obviously related to the strength in Vietnam. India was the worst foreign market, probably due to the tariffs imposed on them by the Trump Administration to punish them for buying Russian oil. Brazil is also being punished by Trump (in this case for matters completely unrelated to national security), but it still managed to gain 10% last month.
5. I would like to tell you that all the strategists were right and lengthening maturities in August paid off. And to a degree I can – intermediate term bonds added about 1.2% versus 0.4% for ultra-short (less than 9 months) bonds and 0.7% for short term (9 months to 3 years) bonds. If you bought long bonds, however, your return diminished. The benchmark gained 0.9% while the 30-year lost 1.5%. Investors are worried about long term inflation. That’s why the best domestic bond category last month was inflation protected securities (+1.5%). Overall, the best category was local currency emerging market debt (+2.1%).
6. September is seasonally not a very good month for U.S. stock investors. With technical indicators already showing signs of upside exhaustion, be careful here. You’ll probably get a better buying opportunity in October. Even the hope of a Fed rate cut on September 17 is probably already discounted in stock prices, so it likely wouldn’t move the market unless Powell suggested that more cuts were coming.
DISCLOSURE
Past performance is no assurance of future results. Trademark Financial Management, LLC (“Trademark”) is a registered investment adviser with its principal place of business in the State of Minnesota. Trademark and its representatives are in compliance with registration requirements imposed upon investment advisers by those states in which Trademark operates. Trademark may only transact business in those states in which it is registered or qualifies for an exemption or exclusion from registration. This newsletter is limited to the dissemination of general information pertaining to its investment advisory/management services. Any subsequent, direct communication by Trademark with a prospective client shall be conducted by a representative that is either registered or qualifies for an exemption or exclusion from registration in the state where the prospective client resides. A complete list of all recommendations will be provided if requested for the preceding period of not less than one year. It should not be assumed that recommendations made in the future will be profitable or will equal the performance of the securities in this list. Opinions expressed are those of Trademark Financial Management and are subject to change, not guaranteed and should not be considered recommendations to buy or sell any security. For information pertaining to the registration status of Trademark please contact Trademark at (952) 358-3395 or refer to the Investment Adviser Public Disclosure web site (www.adviserinfo.sec.gov).
For additional information about Trademark, including fees and services, send for our disclosure statement as set forth on Form ADV from us using the contact information herein or by calling 952-358-3395. Please read the disclosure statement carefully before you invest or send money. Any reference to a chart, graph, formula, or software as a source of analysis used by Trademark Financial Management staff is one of many factors used to make investment decisions for your portfolio. No one graph, chart, formula, or software can in and of itself be used to determine which securities to buy or sell, when to buy or sell them, or assist any person in making decisions as to which securities to buy or sell or when to buy or sell them. Any chart, graph, formula, or software used is limited by the data entered and the created parameters. The data was obtained from third parties deemed by the adviser to be reliable. Nonetheless, the adviser has not verified the results and cannot be assured of their accuracy.
Market Thoughts
Another strong month for the S&P 500 is in the books. The S&P 500 tacked on another 2.2% to get the YTD figure up to 8.4%. The NASDAQ was even stronger at 2.4% and 10.6%, on the back of continued strength from all but two of the Mag 7. Still, when you look at the rest of the U.S. market the month was not all that impressive. Value stock indices rose only half of one percent. Small and midcap stocks rose 1.5% but were very weak over the last five trading days. It just seems like the market has done almost all it can with the good news it has received over the past three months.
International stocks lost money in July. The dollar had a pretty strong month as it rebounded from the oversold levels it hit in early July. Both Japan and Europe made trade deals with the US that appear to be very one-sided, which has positively changed the near- term sentiment towards the dollar. It will be interesting to see if those agreements are actually what they appear to be (or merely just “frameworks” for a deal). It would be fairly shocking if the people of the EU countries accepted the terms as they now stand.
India had a very rough month. President Trump put a 25% tariff on India to punish it for doing business with Russia. Next to Brazil, who Trump punished even more because he is friends with Bolsonero, India was the worst performing significant market. You have to think that every country is thinking about how to reduce its vulnerability to U.S. trade policy.
This morning’s Unemployment Report was a shocker! The 73,000 July figure was disappointing as 110,000 was expected, but it was hardly a market mover in and of itself. The big negative market reaction was for the revisions to the previous two months. May was revised down from 144,000 to 19,000, and June from 147,000 down to 14,000. Those were MASSIVE revisions! The whole narrative flips now from “tariffs don’t seem to be costing the economy anything, so we don’t have to worry about the new ones going into effect in August” to “everything we thought was wrong. Tariffs have been costing the economy jobs for the last three months and now they are about to get even worse”. This is to say nothing about the nature of revisions so large – was it poor data collection in the wake of DOGE cuts or is data being manipulated to appear good upon first release and then the true number is quietly revealed later? In either event, global equity markets are going to struggle with this news, while high quality fixed income should benefit from rates that are almost certainly going lower.
The dollar, which rose almost 4% in July, has given back 1.2% so far this morning. This is enabling foreign equities to lose less than the U.S. for the first time since late May. I suspect there will be those that see this morning’s action as a dip to be bought, but I would agree only if I knew that the proposed tariff increases this month were to again be postponed or rescinded. Either way, I believe bonds are going to see inflows and gold should also benefit as a September rate cut seems all but assured. Some of the hotter areas of the stock market, like semiconductors and the fintech/crypto space, will probably need to consolidate a bit.
One other thing. The most recent Russell ETF reclassification puts Amazon, Alphabet, and META into the Russell 1000 Value Index. If you thought these were growth stocks you can rest easy, they are all still in the Russell 1000 Growth Index as well. If it was your hope that you could use the Russell indices to help you diversify your portfolio and thereby reduce risk, however, I have bad news. If there is a significant technology downturn like there was in 2000 and investors rotate to other industries, your passive value fund is not going to save you.
This might be the thing that revives the municipal bond market. Munis have been plagued for years by low coupons and long durations. This year their prices fell into the dirt-cheap category as municipal issuers sought to float their bonds before the tariffs and the budget bill went into effect, so supply became yet another headwind. Now we may finally be seeing the kind of slowdown that makes these generally high-quality fixed income securities the toast of the bond market again. Tax equivalent yields on investment grade munis are near 7%, whereas on corporate bonds they are less than 6%.
DISCLOSURE
Past performance is no assurance of future results. Trademark Financial Management, LLC (“Trademark”) is a registered investment adviser with its principal place of business in the State of Minnesota. Trademark and its representatives are in compliance with registration requirements imposed upon investment advisers by those states in which Trademark operates. Trademark may only transact business in those states in which it is registered or qualifies for an exemption or exclusion from registration. This newsletter is limited to the dissemination of general information pertaining to its investment advisory/management services. Any subsequent, direct communication by Trademark with a prospective client shall be conducted by a representative that is either registered or qualifies for an exemption or exclusion from registration in the state where the prospective client resides. A complete list of all recommendations will be provided if requested for the preceding period of not less than one year. It should not be assumed that recommendations made in the future will be profitable or will equal the performance of the securities in this list. Opinions expressed are those of Trademark Financial Management and are subject to change, not guaranteed and should not be considered recommendations to buy or sell any security. For information pertaining to the registration status of Trademark please contact Trademark at (952) 358-3395 or refer to the Investment Adviser Public Disclosure web site (www.adviserinfo.sec.gov).
For additional information about Trademark, including fees and services, send for our disclosure statement as set forth on Form ADV from us using the contact information herein or by calling 952-358-3395. Please read the disclosure statement carefully before you invest or send money. Any reference to a chart, graph, formula, or software as a source of analysis used by Trademark Financial Management staff is one of many factors used to make investment decisions for your portfolio. No one graph, chart, formula, or software can in and of itself be used to determine which securities to buy or sell, when to buy or sell them, or assist any person in making decisions as to which securities to buy or sell or when to buy or sell them. Any chart, graph, formula, or software used is limited by the data entered and the created parameters. The data was obtained from third parties deemed by the adviser to be reliable. Nonetheless, the adviser has not verified the results and cannot be assured of their accuracy.
Quarterly Market Summary
Summary
What a turnaround! Stocks soared to a 10.9% quarterly return last quarter after President Trump reversed himself on tariffs. The “Liberation Day” tariff announcement on April 2nd caused a further 12% one-week sell-off after stocks had already fallen 8% from their February 19th highs. Investor sentiment was grim. Then, on April 9th, tariffs on foreign-made goods were largely rescinded for the time being. Stocks rose over 8% that day. Gradually, investors began to believe that their fears about inflation and recession might be overblown. They reasoned that if the administration was simply employing an aggressive negotiating tactic and never really planned on going through with tariffs of 50% and higher, maybe they aren’t as reckless as first thought. The rally really got going after Microsoft’s surprising large earnings beat on April 30th and semiconductor giant Nvidia’s assurance in May that the AI race was just getting started.
As a result, technology was the big sector winner last quarter with a 22.9% gain, but industrials also gained over 12%. Defensive industries like consumer staples (no growth), health care (RFK Jr., Medicaid cuts), and energy[1] lagged badly. U.S stocks are up 6.2% through June 30th.
Foreign stocks have done much better. In local currencies, world stocks rose 8.3% in the first half of the year. Because the U.S. dollar fell sharply as global investors shifted assets out of U.S. markets, dollar-based investors earned nearly 11% more by investing overseas. This finally provided some validation for proponents of international diversification after years of under-performance due to a strong dollar and a less advantageous industry mix[2]. Asian stocks gained the most last quarter led by China. Lessening of trade frictions were good for everybody, but the U.S. and China benefitted the most.
Bonds gained 1.2% last quarter. This is big “cool down” after a strong (2.8%) first quarter. Yields have steadied in a narrow range as investors weigh where inflation and tariff policy are going next. Non-US debt continued to benefit from a weaker dollar. Private credit and mortgage bonds also outperformed. Municipal bonds were once again the worst bond sector. They have become very cheap now, and many bond market experts are saying that this is the time to buy.
Alternative assets such as gold and bitcoin have been choppy, but both have had multiple surges to new highs this year.
Activity
The second quarter came in like a shark and went out like a kitten. The first six trading days of the quarter were wracked with tariff fears and selling, then we got the policy reversal, and then investors increasingly traded stable assets for those that had more upside potential. The key consideration for performance was how strongly one altered their positioning in March in anticipation of tariffs and how quickly one reversed those changes in April or May once the tariff scenario changed. We made moderate risk-off moves in March. By early May we had repositioned portfolios back toward risk assets, but not quite as much as if the whole thing hadn’t happened in the first place. Policy volatility continues to make this an exceptionally challenging (but not necessarily bad!) time to invest.
Outlook
Investors have learned, over the past fifteen years, that if you get a meaningful dip in stock prices you better be a buyer. The vehemence with which bearishness switched to bullishness has reinforced the notion that selling is dangerous – you are probably going to have to buy back whatever you sell, and the price may well be higher then. There are some large tariffs set to take place early next month which if implemented would likely cause stocks here and overseas to fall, but as I write this on July 17, 2025 – the stock market isn’t putting much stock into those concerns. Nobody wants to be the guy who sold out and now has egg on his face because the tariffs were just a bluff and never went into force. In essence the market is playing a giant game of chicken, so to speak. I hope it doesn’t have to blink this time.
Commentary – Warren Buffett and Michael Saylor
This seems like an appropriate time to appreciate the career of Warren Buffett, the chairman of Berkshire Hathaway and perhaps the most famous and successful investor of the past 75 years. Mr. Buffett announced in May at the annual shareholders’ meeting that he was turning the chief executive officer role over to a successor. The 94-year-old Buffett is probably most well-known for his stellar long-term returns, but to professionals his standout quality was his patience. His best returns often came from stocks that had their best years long after Berkshire first purchased them. Mr. Buffett exploited a huge behavioral weakness that investors have – the inability to accurately assess opportunities and risks that would take years instead or months to play out. Time after time he would buy stakes in strong companies that were facing a near-term challenge, then hold them while the challenge was overcome and the stock returned to its upward trajectory. A less appreciated but also important behavioral skill he possessed was the ability to avoid being drawn in by short-term market fads. He would rather let cash accumulate on Berkshire’s balance sheet than overpay for a company just because it was doing well. If you are patient, he argued, you do not have to pay top dollars for the best companies. Eventually, they will come to you. For example, he earned tens of billions of dollars for Berkshire by buying Apple stock during slumps in 2013 and 2016[1].
Warren Buffett’s approach is known as value investing, and it was the model for investing in the 20th Century. It was taught and is still taught in business schools and in the CFA program. But value investing is not the way that most investing is done today. Michael Saylor is the Executive Chairman of a company called MicroStrategy (now just Strategy), and he is a pretty good example the modern investment approach. Strategy borrows money in the bond market and uses the proceeds from its borrowing to buy bitcoins. This works because investors currently value Strategy at roughly twice the value of the bitcoins it holds. Why? Because there are many things you can do with bitcoins (including lending it to speculators for a tidy fee) and because the Trump Administration is very crypto-friendly and is likely to approve even more uses for bitcoin. Since bitcoin was invented back in 2008 it has both risen tenfold and lost two-thirds of its value several times. If Buffett’s edge is patience, Saylor’s edge is fortitude. He can psychologically withstand brutal downturns that the vast majority of investors cannot.
I bring up this comparison not because either Buffett or Saylor is a good or smart person or has the better approach but because I believe both are a product of their times. Warren Buffett was born during the Great Depression. He saw both a World War and decade long periods of time where stocks made investors less than nothing after inflation. He was influenced by Benjamin Graham’s idea of “Margin of Safety” which is decidedly a “First Principle – Don’t lose money” kind of philosophy. On the other hand, Michael Saylor started MicroStrategy in 1989. His investment career coincided with relative political stability and huge gains in the market punctuated by brief downturns in 2000-02, 2007-09, and even shorter ones in 2020 and 2022. He is a very successful investor during a climate where no matter how far asset prices fell, they always came roaring back in fairly short order. Those who picked the right asset (Apple, Nvidia, bitcoin) and went “pedal to the metal” made the most money – if they didn’t lose their nerve. Such is growth investing, and its superiority this century has been amazing.
Maybe this is how the rest of the decade will go. Maybe this is how the entire twenty-first century will go. All I can say is that I can’t believe that it will, and I cannot professionally or personally invest as if I think it will. As a student of market history (going back two centuries), I have recognized a pattern of increasingly speculative excess leading ultimately to very deep busts. The success of Strategy by itself doesn’t say anything about whether or not this is the pre-bust part of a great market cycle. Saylor may just be one of those investment geniuses that arise during both good periods and bad. But coupled with the rise in ways to outright gamble on the market, especially the explosion in options and other forms of leverage and online trading forums, I am convinced that this is one of those speculative eras that will not end well.
That said, I also know that it is beyond my ability to predict when this will happen, so getting super defensive and waiting is just not an option. I know people who have tried that.
Investing always involves risk, but today it involves more risk than usual. Not just because prices are high historically[i], but because there is a similar embrace of risk-taking and risk-takers that I’ve read about in the late 1800s and the 1920s and I lived through in the late 1990s. Moreover, this higher risk behavior is taking place at the same time as America’s policy framework is undergoing significant changes not seen since the 1930s, and at a time where corporate America is betting VERY BIG on artificial intelligence. Those are important topics whose implications I’d like to address in future Commentaries, but don’t have enough room left in this one.
So, in conclusion I’d like to thank Warren Buffett for his contributions to the field of investment analysis and management as well as to the pocketbooks of all of us who have invested over the last forty or so years. I’d also like to thank growth investors like Michael Saylor who remind investors more psychologically sympathetic to value strategies, like myself, that growth tends to perform a lot better than value when the financial and geo-political winds are at your back. I hope that this continues to be the case.
DISCLOSURE
Past performance is no assurance of future results. Trademark Financial Management, LLC (“Trademark”) is a registered investment adviser with its principal place of business in the State of Minnesota. Trademark and its representatives are in compliance with registration requirements imposed upon investment advisers by those states in which Trademark operates. Trademark may only transact business in those states in which it is registered or qualifies for an exemption or exclusion from registration. This newsletter is limited to the dissemination of general information pertaining to its investment advisory/management services. Any subsequent, direct communication by Trademark with a prospective client shall be conducted by a representative that is either registered or qualifies for an exemption or exclusion from registration in the state where the prospective client resides. A complete list of all recommendations will be provided if requested for the preceding period of not less than one year. It should not be assumed that recommendations made in the future will be profitable or will equal the performance of the securities in this list. Opinions expressed are those of Trademark Financial Management and are subject to change, not guaranteed and should not be considered recommendations to buy or sell any security. For information pertaining to the registration status of Trademark please contact Trademark at (952) 358-3395 or refer to the Investment Adviser Public Disclosure web site (www.adviserinfo.sec.gov). For additional information about Trademark, including fees and services, send for our disclosure statement as set forth on Form ADV from us using the contact information herein or by calling 952-358-3395. Please read the disclosure statement carefully before you invest or send money. Any reference to a chart, graph, formula, or software as a source of analysis used by Trademark Financial Management staff is one of many factors used to make investment decisions for your portfolio. No one graph, chart, formula, or software can in and of itself be used to determine which securities to buy or sell, when to buy or sell them, or assist any person in making decisions as to which securities to buy or sell or when to buy or sell them. Any chart, graph, formula, or software used is limited by the data entered and the created parameters. The data was obtained from third parties deemed by the adviser to be reliable. Nonetheless, the adviser has not verified the results and cannot be assured of their accuracy
[1] He was a heavy seller in 2024 at prices 6-9 times higher.
[i] Stock are statistically expensive, but that has been the case for most of the last forty years, so this fact has almost no predictive value.
[1] Energy investors always assumed that a war in the Middle East would send oil prices soaring. When the war came and went and prices were only briefly affected, the “conflict premium” declined considerably.
[2] Far more of the U.S. market is in technology, the best performing sector of the last fifteen year, than foreign markets contain.