Sometimes a quarter passes and nothing much happens. Other times, so much happens in a quarter that it seems like a full year. The first quarter of 2022 falls into the latter category. Supply bottlenecks and then, of course, the inflationary implications of the war in Ukraine brought large price changes to bonds (negative) and commodities (positive). Energy and resource-related stocks were the biggest beneficiaries because supply disruption translates to higher selling prices. Other sectors could not as easily pass on their higher costs. Technology and consumer discretionary stocks were the biggest losers in the latter category, dropping around nine percent.
The S&P 500 large company stock index, down more than -10% on March 14th, managed to recover over half of that by quarter end to finish off -4.6%. The late quarter bounce was driven by the desire for safer, larger, dividend paying stocks, thus small caps had a much smaller bounce and finished -7.5%. The technology-driven NASDAQ Composite Index was off -8.9%. As we shall see below, there was no help from foreign stocks or bonds last quarter; only utilities and commodity-oriented funds managed to post a gain. Energy was far and away the best sector last quarter, but as it represented less than 4% of the S&P 500 at the start of the quarter, it could hardly offset the negative impact of technology (almost 25% of that index).
As a whole, international stocks were down -5.9% last quarter. Again, there were bright spots. Latin America, on the strength of soaring demand for Brazilian oil, Argentinian agricultural products and Chilean copper (among other things) roared ahead 27.3% last quarter. That said, Latin America accounts for less than 2.5% of the total international index, so the drag from Europe (-9.6%), China (-14.5%) and Japan (-6.6%) was just too strong. Most international markets were not helped by ongoing strength in the U.S. dollar.
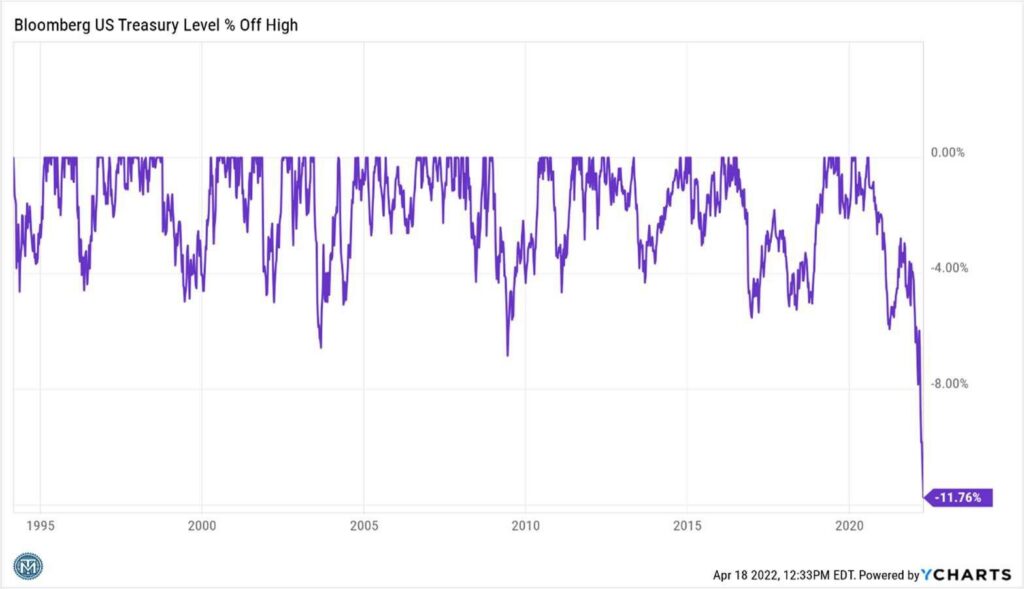
The current drawdown, which began in late 2020, is the worst drawdown for bonds in over 30 years. This chart was first published by Lyn Alden Research, a great source of market information.
Bond investors experienced their worst quarter in more than 40 years. The benchmark Bloomberg Aggregate Bond Index fell a staggering 5.9%. Considering that the index yields around 2%, roughly three years’ worth of coupon payments were lost last quarter. The bond market had been telegraphing weakness for quite some time, so we were able to substantially reduce interest rate sensitivity before bond yields had their big post-invasion spike. Other than short term floating rate treasuries (+0.2%), one could not have made money in bonds this past quarter. Municipal bonds performed especially poorly (-6.2%) as very low yields and overbuying in 2021 made them particularly vulnerable to rising interest rates and investor flight. High yield corporate bonds lost -4.8%.
Activity
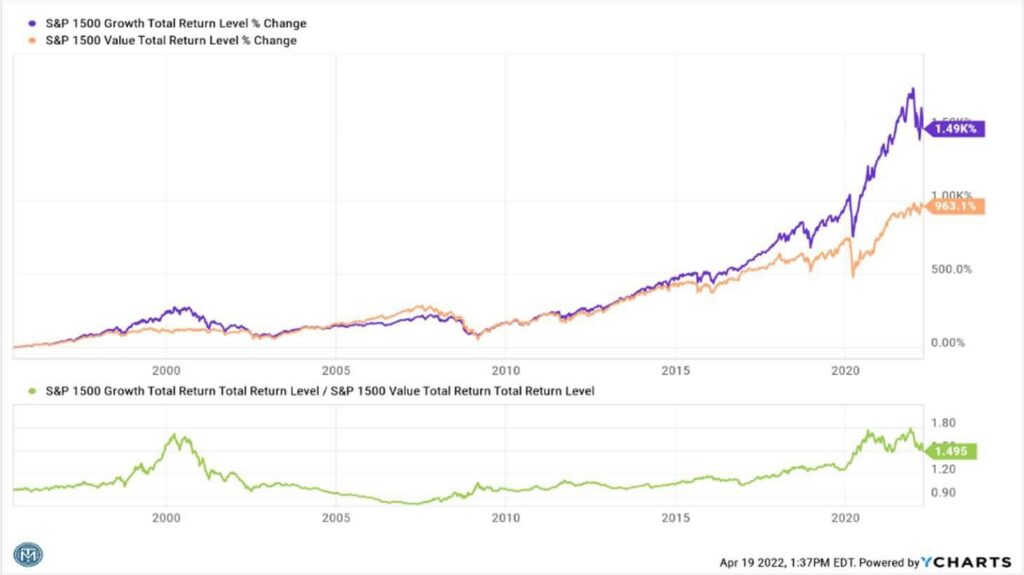
Since this was a very eventful quarter, there was much more activity than usual. As interest rates rise, future earnings become less and less valuable relative to current earnings. If the rise in interest rates is gradual, the stock market tends to take it in stride. If rates rise sharply, as they did this past quarter, the stock market gets alarmed. In fact, the whole valuation paradigm of the market can be thrown into question. Specifically, if the prevailing environment is low and generally declining interest rates, as it had been the great majority of the time between 2009 and 2021, it makes sense to pay up for rapidly growing companies even if that rapid growth is still in the revenue stage and had not progressed to actual net profits. If, however, interest rates begin to soar and funding costs climb, investors quickly tire of rapidly growing, unprofitable, companies that need to spend every dollar of revenue to fund growth. Not when they can buy a company that is already profitable and seeing demand for its products grow such that it is able to raise prices faster than its input and labors costs are rising. This is how natural gas and coal investors make 35% in a quarter while biotechnology and software-as-a-service investors lose 35%. Growth is out, value is in. Small caps, especially if they are growth-oriented and outside the U.S., are especially vulnerable when the paradigm changes back to “bird-in-the-hand” companies and away from “two-in-the-bush”.
Growth makes a big run about once in a generation, but the outperformance doesn’t last. It’s previous run (1968-72) was erased by the end of 1974.
The number of changes necessary for most portfolios required a complete re-balance. Because we had already reduced the duration (interest rate sensitivity) of the bond portion of portfolios in 2021, the biggest change on the bond side last quarter was the outright substitution of alternatives like commodities, real estate, or merger arbitrage for coupon paying bond funds.
Outlook
In my investing career I have never seen a wider range of possible market and economic outcomes than exist today – Doug Kass, President, Seabreeze Partners
First of all, bond yields have moved up a considerable amount in a very short period of time, so I expect yields to stabilize in the short run. That should be a positive. I am concerned that the Federal Reserve has, because it was overly accommodative in 2019 and again in 2021, put itself in a position where it probably needs to err in the other direction over the next few months. The resulting contraction in liquidity is probably not going to do markets much good. With an ongoing crisis in Ukraine and the midterm election coming up, it just feels like the headwinds exceed the tailwinds this year. Allocating a higher percentage to hard assets like industrial and agricultural commodities, precious metals, and energy seems like a prudent way to get through what promises to be a prolonged period of above average inflation.
Looking farther out, the recent correction in growth stock prices has made this sector of the market much cheaper. Strong companiesthat sported eye-watering P/E multiples last year such as Adobe, Chipotle, Nvidia, and Intuitive Surgical are down 20%-40%, so while not cheap per se, they are at least much more reasonable. They have a good chance of rallying once investors believe that the end of the Federal Reserve rate hiking cycle is in sight.
Commentary– of Trends, Wolves, Torches and Lebron James
It’s a tough quarter when somewhere around 96% of one’s investable universe declines in price, but that happens sometimes. I’ve certainly gone through many quarters when 96% or more of everything we track went up in price. When the interest rate and liquidity trends are at your back, investing is fairly easy. On the other hand, if those trends are working against you, investing is much harder – with the only reward sometimes being that one loses less. That doesn’t have to be a bad thing. Investing is cyclical. Bad periods set up good periods, and vice versa. You cannot survive as a money manager projecting current trends into infinity.
I remember when the yield on the 10-year bond fell to less than 0.6% back in August 2020. That was great if one had been a bond buyer in any of the previous 40 years, but where do you go from there? Inflation was running at about 2%, so buyers at 0.6% were getting no inflation protection. The only chance of a positive real return was that interest rates went even lower. You didn’t need to know that interest rates were going to soar in the first quarter of 2022 to know that buying the 10-year at that point was a terrible bet. It was like watching Lebron James score 55 points in a basketball game and betting that he will score 60 points in the next game. It’s not impossible, but the odds are not in your favor. The odds were also not in your favor if you paid $500 per share for Zoom Video in October 2020 or $160 for Zillow in February 2021. You were betting that an explosive trend (in this case, shop from home) would continue to grow at exponential rates.
The nature of trends is that the longer they last the more powerful they tend to be, but that all trends eventually end. Stocks with a high and consistent rate of annual earnings growth (growth stocks in the parlance) performed extremely well in the low interest rate environment of the past decade. On one hand it was a mistake to assume their outperformance would end simply because they had become expensive (in some cases very expensive), because bull markets are generally not killed off by valuation. On the other hand, it was a mistake to assume the growth stock run would never end. Rising rates and tight credit are like kryptonite for growth stocks. There were two periods – late 2015 into 2016 and late 2018 – where worsening credit conditions led to 15-20% drops in growth stock prices. In each case, the economy slowed, the Fed reversed itself, and these stocks were off to the races again. Therefore, an experienced manager doesn’t panic when growth stocks hit an 8-10% skid as they did in February and again in October of 2021.
The decline that began on December 28th of last year was not a concern until the rally attempt at the end of January quickly failed and lower lows were made – even before the Russian invasion of Ukraine. This was new. As the market began to digest the impact of wage inflation driven by the difficulty finding qualified available workers and of goods inflation driven by raw materials shortages and shipping bottlenecks, it was suddenly confronted with a regional war. A significant amount of energy and agricultural commodities were effectively taken “off-line” through a lack of available workers (Ukraine) or embargo (Russia) – which only makes the goods inflation situation worse. At this point we had not just a sell-off but a change in the narrative driving the market – that rising inflation wasn’t a transitory event but in fact a structural change that would usher a new group of companies into market leadership.
The point here is that the first perhaps 5-8% stock market decline is noise. Markets fluctuate. If you aren’t conformable with that, you should probably buy a CD or a fixed annuity instead. Most declines of this magnitude don’t last very long. The proper course of action in most cases is to do very little. Every so often, however, the market will cry wolf and there will actually be a wolf. Those are the times where you have to be prepared to act. As a manager, I really don’t expect to add value in a 5% decline. I’m not going to radically change a portfolio for a decline that small or else I’d constantly be buying and selling. I also know that it is hard to add value in a crisis decline like March 2020 because that situation was completely emotional and nearly impossible to model. Where managers can add the most value is in a prolonged decline. The more the market loses, the less I expect to participate in that decline because I can discern what the new narrative is and I can re-position portfolios away from the most vulnerable areas. The bear market that ran from March of 2000 through October 2002 was much easier to outperform after the Autumn of 2000 because it had become clear that the growth narrative had been broken and the technology sector no longer carried the torch of market leadership.
Periods of strong performance almost always lead to periods of low performance, because as asset prices rise in excess of the increases in their intrinsic value, valuation deteriorates. Happily, that process also works in reverse. If we have to endure a multi-year period of poor bond returns while bond yields rise to a level that better compensates us for taking inflation risk, that’s fine. We’ll get through it by underweighting bonds and overweighting hard asset alternatives. After a decade of fairly poor-to-terrible returns, most commodity producers are undervalued despite having done very well this year. The conditions they required in order to thrive have finally come to pass. Energy stocks are about 4% of the S&P 500 and Basic Materials stocks are less than 2.5% today – less than half of where they were at their peaks in 1980. That’s kind of like betting on Lebron the game after he’s just had a 15 point game; not a guarantee but attractive from a probability standpoint. At the end of the day, as investment managers, that (putting the odds in your favor and watching carefully to see that they remain there) is one of the most impactful things we can do.
Updated Statement Benchmarks
Please note that we updated the benchmarks on our quarterly statement to be in greater alignment with industry standards. We believe the updated benchmarks better highlight the broad array of investment possibilities as they more clearly delineate the asset classes in which we invest. A brief explanation of our new benchmarks is below. Please don’t hesitate to reach out with questions.
S&P 500
The S&P 500 is used to track the performance of the United States stock market. The index covers the 500 largest companies by market capitalization. This represents a little over 80% of the total capitalization of the U.S. stock market. These companies vary widely across the sector spectrum, covering both manufacturing and service companies.
Russell 2000
The Russell 2000 is used to track the performance of smaller companies in the United States. It tracks the roughly 2000 securities considered to be among the smallest US companies. It is a capitalization-weighted index made up of the smallest 2,000 U.S. common stocks as measured by market capitalization included in the Russell 3000 Index, which consists of the largest 3,000 U.S. common stocks based on market capitalization. There are between 3700 and 3800 listed companies on U.S. exchanges right now, so the Russell 3000 covers more than 99% of total U.S. market capitalization. This gives you some idea of how small the smallest 700-800 companies must be.
MSCI ACWI Ex-US
The MSCI All Country World Index Ex-US is used to track the performance of stock markets around the world, excluding the United States. It captures large and mid-cap representation across 22 or 23 Developed Markets (DM) countries (excluding the US) and 25 Emerging Market (EM) countries. With 2,300 constituents, the index covers approximately 85% of the global equity opportunity set outside the US.
Bloomberg US Aggregate Bond Index
The Bloomberg US Aggregate Bond Index is used to track the performance of the United States investment grade (BBB-rated or higher) bond market. It is a broad-based benchmark that measures the investment grade, US dollar-denominated, fixed-rate taxable bond market. The index includes Treasuries, government-related and corporate securities, MBS (agency fixed-rate pass-throughs), ABS and CMBS (agency and non-agency). In May 2019, 72% of all U.S. bonds were investment grade. This number fluctuates due to economic conditions and investor preferences.
Over the course of 17 days (March 6th to March 23) the market discounted the absolute worst-case scenario and then began to walk it back, slowly at first and then rapidly by June.
Disclosure
Past performance is no assurance of future results. Trademark Financial Management, LLC (“Trademark”) is a registered investment adviser with its principal place of business in the State of Minnesota. Trademark and its representatives are in compliance with registration requirements imposed upon investment advisers by those states in which Trademark operates. Trademark may only transact business in those states in which it is registered or qualifies for an exemption or exclusion from registration. This newsletter is limited to the dissemination of general information pertaining to its investment advisory/management services. Any subsequent, direct communication by Trademark with a prospective client shall be conducted by a representative that is either registered or qualifies for an exemption or exclusion from registration in the state where the prospective client resides. A complete list of all recommendations will be provided if requested for the preceding period of not less than one year. It should not be assumed that recommendations made in the future will be profitable or will equal the performance of the securities in this list. Opinions expressed are those of Trademark Financial Management and are subject to change, not guaranteed and should not be considered recommendations to buy or sell any security. For information pertaining to the registration status of Trademark please contact Trademark at (952) 358-3395 or refer to the Investment Adviser Public Disclosure web site (www.adviserinfo.sec.gov).
For additional information about Trademark, including fees and services, send for our disclosure statement as set forth on Form ADV from us using the contact information herein or by calling 952-358-3395. Please read the disclosure statement carefully before you invest or send money. Any reference to a chart, graph, formula, or software as a source of analysis used by Trademark Financial Management staff is one of many factors used to make investment decisions for your portfolio. No one graph, chart, formula, or software can in and of itself be used to determine which securities to buy or sell, when to buy or sell them, or assist any person in making decisions as to which securities to buy or sell or when to buy or sell them. Any chart, graph, formula, or software used is limited by the data entered and the created parameters. The data was obtained from third parties deemed by the adviser to be reliable. Nonetheless, the adviser has not verified the results and cannot be assured of their accuracy.
The stock market recovery that began on March 15th has stalled out as comments by Fed Governor Lael Brainard on Monday scared investors in terms of the amount of Quantitative Tightening that might occur later this year and into next year. The stock rally had as its narrative underpinning the idea that while the Fed might say they were going to hike rates seven times or more, economic and market weakness would never permit that. Stock investors are uncomfortable with interest rate hikes and the Fed contracting liquidity at the same time. The analog is the fourth quarter of 2018. When the Fed actually began withdrawing liquidity, stocks dropped about 8% (9/20/18 to 10/25/18). The market then rallied for two weeks for the same reasons it has recently – stocks were technically oversold, the economy continued to grow, and though the yield curve had modestly inverted, the timing of weakness was uncertain. A strong-ish unemployment report in early December 2018 confirmed the Fed was right to tighten, and stocks began to fall in earnest. The employment report we received last Friday (4/1/22) confirmed to the Fed that a 50 basis point move at the next meeting (May 4th) was probably warranted. Brainard’s speech was the catalyst for short term interest rates to soar (since she implied that the Fed was going to be rapidly moving from modest purchases of short-term bonds to fairly heavy sales). This is obviously not good news for any security whose valuation depends on lower interest rates, including growth stocks and homebuilders. The concern now, of course, is about a rapid stock sell-off like the one we got in December of 2018 as stocks protested Fed policy. And lest you conclude that the Fed will capitulate this Spring as it did back then, I would point out that reported inflation was around 2% at that time versus upwards of 7% today. The Fed knows it screwed up last time. It won’t want to make that mistake again.
Commodities continue to outperform both stocks and bonds. The War in Ukraine is a major part of this as it has lit a fire, so to speak, under both energy and agricultural prices. The problem is that even before the invasion there were structural issues – underinvestment, transportation snarls, etc. – affecting commodity prices. Commodity-driven inflation is going to moderate, even if the war is swiftly concluded, but it is not going away for the foreseeable future. The energy and materials sectors may be outperformers for a considerable period of time. Note that commodities are up 27% year to date, yet gold is up less than 5% and bitcoin is negative. This suggests that the commodity surge is not about the general level of inflation; it is about demand exceeding supply and supply not being either able or willing to fill that gap.
It’s probably an oversimplification to say that value is winning and growth is losing this year. 2022’s winning sectors tend to have lower price-earnings ratios because they are cyclical (energy, materials, etc.), but not all low P/E stocks are winners (financials and industrials are single-digit down this year). The vast majority of high P/E stocks are losers, especially technology, biotech, financial tech, and consumer discretionary). Cybersecurity is the only high P/E subsector that is beating the market right now, though there are many consumer staples companies like Procter and Gamble that have high P/E ratios and are outperforming.
Most bond managers that I’ve talked to recently expect interest rates to peak, and soon, especially at the long end (10 to 30 years). They believe the economy cannot withstand rates much higher than where they are now for very long, and once it is more broadly felt that the economy is headed for a rough landing (May or June?), long bonds will be an exciting capital gain opportunity. Michael Collins of PGIM said this morning that he expected the 10-year bond to fall back below 1.50% in the next easing cycle. This is regardless of where inflation is (though it should be noted that he expects it to fall back to the 2-3% level). According to Schwab’s Jeffrey Kleintop (as reported by Lyn Alden), only 17% of the yield curve have inverted (there are many, many yield curves). Historically, 50% or more of the yield curves inverting has signified recession.
Disclosure
Past performance is no assurance of future results. Trademark Financial Management, LLC (“Trademark”) is a registered investment adviser with its principal place of business in the State of Minnesota. Trademark and its representatives are in compliance with registration requirements imposed upon investment advisers by those states in which Trademark operates. Trademark may only transact business in those states in which it is registered or qualifies for an exemption or exclusion from registration. This newsletter is limited to the dissemination of general information pertaining to its investment advisory/management services. Any subsequent, direct communication by Trademark with a prospective client shall be conducted by a representative that is either registered or qualifies for an exemption or exclusion from registration in the state where the prospective client resides. A complete list of all recommendations will be provided if requested for the preceding period of not less than one year. It should not be assumed that recommendations made in the future will be profitable or will equal the performance of the securities in this list. Opinions expressed are those of Trademark Financial Management and are subject to change, not guaranteed and should not be considered recommendations to buy or sell any security. For information pertaining to the registration status of Trademark please contact Trademark at (952) 358-3395 or refer to the Investment Adviser Public Disclosure web site (www.adviserinfo.sec.gov).
For additional information about Trademark, including fees and services, send for our disclosure statement as set forth on Form ADV from us using the contact information herein or by calling 952-358-3395. Please read the disclosure statement carefully before you invest or send money. Any reference to a chart, graph, formula, or software as a source of analysis used by Trademark Financial Management staff is one of many factors used to make investment decisions for your portfolio. No one graph, chart, formula, or software can in and of itself be used to determine which securities to buy or sell, when to buy or sell them, or assist any person in making decisions as to which securities to buy or sell or when to buy or sell them. Any chart, graph, formula, or software used is limited by the data entered and the created parameters. The data was obtained from third parties deemed by the adviser to be reliable. Nonetheless, the adviser has not verified the results and cannot be assured of their accuracy.
Follow-ups and New Thoughts:
• My first investment thought today is that TIPs just became more interesting. TIPs started to fade as investors contemplated 5-7 rate hikes, because coupon bonds would then provide more inflation protection. If we assume that the Russian invasion means high prices on raw materials and fewer rate hike as the global economy slows, the inflation protection TIPs provide is more valuable.
• The dollar, at least in the short run, is going to be strong. Unhedged foreign bonds are just not going to do well right now. There is still going to be a great opportunity to play the falling dollar, but that time is not now.
• One of the first reaction to a chaotic global situation is often to buy gold. I think this would make a lot of sense if I were a euro or yen or EM currency investor, but as a dollar-based investor I am only mildly enthused. A currency flight-to-quality generally doesn’t do much for gold in the country with the highest quality currency. Given Ukraine’s status as a potash producer, I would rather speculate on the agricultural implications of the invasion. Consider buying fertilizer companies
Today’s market action has been buy growth and sell value in the U.S., because long term rates declined sharply overnight and the yield curve flattened. I am very skeptical that this is a good trade for all but the shortest-term investors. In fact, I believe today is a bad day to trade overall. There is a lot of knee jerk activity, and the price of anything you think you might want to buy or sell has probably already moved quite a bit. We came into today with stocks already well off their most recent highs, so there isn’t a lot of “air” underneath prices. Much of the speculative premium has been beaten out of the market (just ask Cathie Wood). Also, the nature of events like invasions where power is asymmetric is that the market impact doesn’t last long.
Disclosure
Past performance is no assurance of future results. Trademark Financial Management, LLC (“Trademark”) is a registered investment adviser with its principal place of business in the State of Minnesota. Trademark and its representatives are in compliance with registration requirements imposed upon investment advisers by those states in which Trademark operates. Trademark may only transact business in those states in which it is registered or qualifies for an exemption or exclusion from registration. This newsletter is limited to the dissemination of general information pertaining to its investment advisory/management services. Any subsequent, direct communication by Trademark with a prospective client shall be conducted by a representative that is either registered or qualifies for an exemption or exclusion from registration in the state where the prospective client resides. A complete list of all recommendations will be provided if requested for the preceding period of not less than one year. It should not be assumed that recommendations made in the future will be profitable or will equal the performance of the securities in this list. Opinions expressed are those of Trademark Financial Management and are subject to change, not guaranteed and should not be considered recommendations to buy or sell any security. For information pertaining to the registration status of Trademark please contact Trademark at (952) 358-3395 or refer to the Investment Adviser Public Disclosure web site (www.adviserinfo.sec.gov).
For additional information about Trademark, including fees and services, send for our disclosure statement as set forth on Form ADV from us using the contact information herein or by calling 952-358-3395. Please read the disclosure statement carefully before you invest or send money. Any reference to a chart, graph, formula, or software as a source of analysis used by Trademark Financial Management staff is one of many factors used to make investment decisions for your portfolio. No one graph, chart, formula, or software can in and of itself be used to determine which securities to buy or sell, when to buy or sell them, or assist any person in making decisions as to which securities to buy or sell or when to buy or sell them. Any chart, graph, formula, or software used is limited by the data entered and the created parameters. The data was obtained from third parties deemed by the adviser to be reliable. Nonetheless, the adviser has not verified the results and cannot be assured of their accuracy.
Follow-ups and New Thoughts:
Bill Hinch is a 35-year investment veteran who now runs the First Eagle Small Cap Opportunity Fund after a long, successful stint at Royce Funds. I took the following notes from his presentation last Tuesday night:
• Inflation tends to favor smaller companies
• Small and mid-size banks can often times be more accurately characterized as real estate companies
• To win in small caps you need to have nerve, because the best returns occurs as you come out of the worst environments. You not only have to resist the urge to sell during price declines, but you have to have the guts to buy them. Very few people do. Therefore…
• Good small cap managers will underperform in down markets, because they will be the only ones disciplined enough to buy weakness.
• Small cap investors need to get paid a premium for illiquidity and lack of management depth.
• Concentration doesn’t work in small caps. You can get out of a mistake in a large cap with a modest penalty, but having a large position in a small, illiquid stock that blows up will kill you.
• Some of the best opportunities come from investing in companies that are temporarily losing money
• That said, avoid investing in companies that have never earned money.
• Value managers almost never get to invest in a great company with great management; that’s why most managers don’t like that sector.
• In a tough small cap market, there will be no bids. You have to buy companies as if you are never going to sell them, because occasionally you can’t.
As I thought about this afterward, I recalled my education in the securities business back in the 1980s. Studies had just come out that showed that small stocks outperformed large stocks by several percentage points per year over time. These studies also showed that buying stocks with low price-to-book-value ratios was the best way to outperform the market. In the late 1980s and early 1990s, almost everyone invested this way.
As we now know, this was a sure recipe for under-performance. Why? Because those academic studies contained biases the authors didn’t allow for. The so-called small cap effect didn’t take into consideration survivorship bias. In other words, the data collected did not include the many small companies that went out of business in the 1930s and to a lesser extent the 1970s. By only counting the returns of the survivors, they overstated the returns anybody investing at the time would have received because they couldn’t have known which businesses would fail. The value bias stemmed from the fact that detailed investment recordkeeping really didn’t begin until about 1927. Interest rates were quite low then, around 2%. Studies done in the mid-1980s (made possible by big advances in computing power), with inflation around 9% after having risen to more than 14%, favored asset heavy companies because the value of their raw materials, equipment, and property had inflated at very high rates. Growth companies did not do nearly as well because with a double-digit cost of funds, they couldn’t fund losses anywhere near as long as companies can today.
The point of this is that we can’t know what the future will bring, or which of the assumptions that we all have with regard to the markets will prove to be dead wrong in hindsight. That said, investing in areas that have been thirty-year winners – like large cap growth (and U.S. stocks in general) – is more dangerous because it is easy to make the assumption these areas will continue have systematic advantages that the future is sure to reward. I have seen consumer staples and pharmaceuticals command premium multiples in the late 1980s and early 1990s, technology in the mid-to-late 1990s, financial services and real estate in the early 2000s, and energy in 2007 and 2008. Every one of these sectors gave up their premiums when costs, competition, regulation, and/or commodity prices changed the game.
So far, a good year for diversification. The U.S. stock market under-performed Europe, Japan, Asia-ex-Japan, Frontier Markets, and especially Latin America in January. Let’s see if that continues. Commodities were the strongest sector, though gold did not participate in the commodity rally. A lot of things are touted as inflation hedges (even bitcoin lately) that are actually fairly miserable in this regard over short and intermediate time periods.
Disclosure
Past performance is no assurance of future results. Trademark Financial Management, LLC (“Trademark”) is a registered investment adviser with its principal place of business in the State of Minnesota. Trademark and its representatives are in compliance with registration requirements imposed upon investment advisers by those states in which Trademark operates. Trademark may only transact business in those states in which it is registered or qualifies for an exemption or exclusion from registration. This newsletter is limited to the dissemination of general information pertaining to its investment advisory/management services. Any subsequent, direct communication by Trademark with a prospective client shall be conducted by a representative that is either registered or qualifies for an exemption or exclusion from registration in the state where the prospective client resides. A complete list of all recommendations will be provided if requested for the preceding period of not less than one year. It should not be assumed that recommendations made in the future will be profitable or will equal the performance of the securities in this list. Opinions expressed are those of Trademark Financial Management and are subject to change, not guaranteed and should not be considered recommendations to buy or sell any security. For information pertaining to the registration status of Trademark please contact Trademark at (952) 358-3395 or refer to the Investment Adviser Public Disclosure web site (www.adviserinfo.sec.gov).
For additional information about Trademark, including fees and services, send for our disclosure statement as set forth on Form ADV from us using the contact information herein or by calling 952-358-3395. Please read the disclosure statement carefully before you invest or send money. Any reference to a chart, graph, formula, or software as a source of analysis used by Trademark Financial Management staff is one of many factors used to make investment decisions for your portfolio. No one graph, chart, formula, or software can in and of itself be used to determine which securities to buy or sell, when to buy or sell them, or assist any person in making decisions as to which securities to buy or sell or when to buy or sell them. Any chart, graph, formula, or software used is limited by the data entered and the created parameters. The data was obtained from third parties deemed by the adviser to be reliable. Nonetheless, the adviser has not verified the results and cannot be assured of their accuracy.
Summary
The stock market shrugged off several attempts at a broad sell-off last quarter to eventually end up about 11% higher. Both November and December saw drawdowns of more than three percent before sharp reversals led to new all-time highs. Of course, this is only true if we consider the largest U.S. companies as “the stock market”. If I were describing last quarter’s performance by small and mid-size companies, I could have written the following: “the stock market ran up sharply in October only to decline even faster in November. A modest early December rebound quickly failed as did a late December bounce. The Russell 2000 small cap stock index gained only 2.1%1 on the quarter”. Likewise, discussion of international stocks would have looked strikingly similar; a lot of choppiness and a modest gain (up 2.7%). The utterly massive performance of just a few stocks has distorted everything. Semiconductor chip-making powerhouse Nvidia was up 42%2 last quarter, while Tesla soared 36%, Apple 26%, and Microsoft just under 20%. Mega-cap health juggernaut UnitedHealth Group rose 29% and Home Depot climbed 27%. More on this below.
Bonds continued to struggle in the face of rising interest rates. The Bloomberg Aggregate Bond Index gained exactly 0.01%, which lifted its return for the full year from -1.55% to -1.54%3. Ouch. By reducing interest sensitivity, either through buying shorter maturity bond or lower credit debt, it was possible to reduce or eliminate losses in a bond portfolio, but even the very best bond category still paled in comparison to most stocks. The positive in terms of bond ownership is that as yields rise, newly issued bonds have higher coupons. That means future bond market returns should improve.
European stocks were the next best performers last quarter, gaining 5.1%.4 China continued to drag Asia lower. China lost a little over 6% as investors continued to question Chinese economic policies and the real estate sector was reeling from the Evergrande crisis. Japan also fell almost 4%, but international analysts tend to regard that country as very cheap. It is easy to write off non-U.S. markets because of their poor relative performance over the past decade, but investors cannot invest in past returns. Going forward, the vast valuation discrepancies in foreign based stocks versus U.S. stocks make foreign markets attractive – if not immediately then at least on a 5-10 year basis.
Activity
We have been more active lately as financial markets show signs of succumbing to the pressure of rising interest rates. When interest rates rise, several things happen:
1. Existing bonds decline because their coupons become less attractive relative to new bonds with higher coupons;
2. Stocks decline, because the value of their future dividends and/or future cash flows are worth less when discounted to the present; and
3. Gold may also worth less if interest rates increase faster than underlying inflation, such that they (interest rates) more fairly compensate investors from inflation.
As investors, we really don’t want to see inflation. It is almost never helpful. The problem is, if interest rates are kept artificially low, inflation eventually results. For years the Fed has kept inflation largely confined to the stock and real estate markets. The Covid crisis ended this, because the pandemic forced production shutdowns because of the unavailability of labor and/or materials. The obvious consequence of scarcity of materials and labor is higher prices and wages.
In bond portfolios we have been reducing interest rate sensitivity by exchanging into shorter duration bonds with higher yields. In some instances, we have substituted alternatives such as convertible or merger arbitrage for some of our bond exposure. In stock portfolios we have reduced exposure to the highest volatility stock positions. For the most part these were funds that focused on disruptive technologies which, while promising, will generate most of their profits in the distant future and as such cannot be valued as highly when interest rates are rising.
Outlook
What we’ve seen so far in January is either a needed correction that will set the stage for the next leg of rally once interest rates stabilize, or evidence that the speculative post-covid liquidity bubble has popped in which case stocks will not stop falling until all the speculative excess has been wrung out. Corrections caused by excessive valuation running into more restrictive monetary policy are not rare – we saw two in 2018 and one in each of the preceding eight years (except 2013 and 2017). Full fledged paradigm shifts tied to a crisis in one or multiple sectors of the economy are far more rare, and indeed, not what we expect this time either. Still, it can be unpleasant to go through these periodic downturns.
We are seeing some very strong companies starting to be sold off lately. We didn’t take it as a general warning when some of the highest post-Covid flyers like Zoom and Roku and Zillow ran into trouble last year because they are not very representative of the market as a whole. If a correction would come along that impacted Apple, Microsoft, Nvidia, Adobe, and the like – then you’d know investors were finally starting to care about inflation. That is where we stand today. Again, I believe this dip will be bought much like the others in this long bull market. The economy isn’t slowing at this point and interest rates are still low (the 10-year bond still yields less than 2%). Again, I believe this decade we will see a paradigm shift that causes U.S. interest rates to move to a higher range and makes non-U.S. assets more attractive, but this will take years to evolve.
Commentary
One good thing about analyzing very large companies like Apple, Microsoft, and Nvidia with hindsight is that you can say conclusively that none of them deserved their huge stock price surge. Their size is such that their profits could not possibly have grown fast enough to justify a 20% quarterly gain on top of their gains of the first three quarters of 2021. If we know, therefore, that the prices of U.S. mega-caps are not justified by their economic performance, why are they so high? Because they have pulled in capital from all over the globe seeking growth and safety in a world where growth has largely (but not exclusively) been confined to American companies and safety has meant that the earnings yields on blue chip U.S. companies (even with price-to-earnings ratios above 35) exceed what one could earn from the bond market, many regarded them as being bond substitutes. Years ago we even coined an acronym – TINA – for the idea that as far as U.S. stocks are concerned, There Is No Alternative.
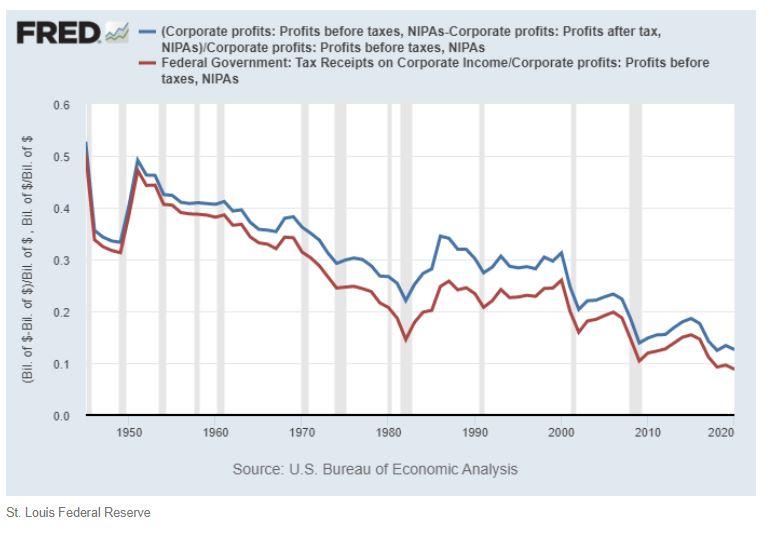
Over the past decade or so, U.S. investors have been rewarded for behaving as if there was no alternative to U.S. stocks. It is my belief, however, that the “TINA Era” is in the process of ending. Imagine the Pacific Ocean at rest. Waves aren’t cresting in Japan, nor are they high in Oregon, Peru, or Australia. Now imagine the strongest hurricane force winds ever recorded blowing due northeast. The entire Pacific Ocean is being pushed toward the U.S. west coast, hard. The hurricane in this allegory is the combined forces of U.S. economic and taxation policy (a 40-year shift in tax policy away from corporations and toward individuals, chart 2), the U.S. dollar’s global reserve currency status, and the global oil payment system. All of this combines to drive money into the U.S. stock market and especially to biggest and the most liquid companies therein. The winds may fluctuate in intensity, but they never completely let up, so the world gets used to what would normally be regarded as very unusual circumstances. The U.S. dollar is expensive relative to all other currencies because everyone needs it to buy oil and U.S. equities (which have been at multi-decade highs, at least until recently).
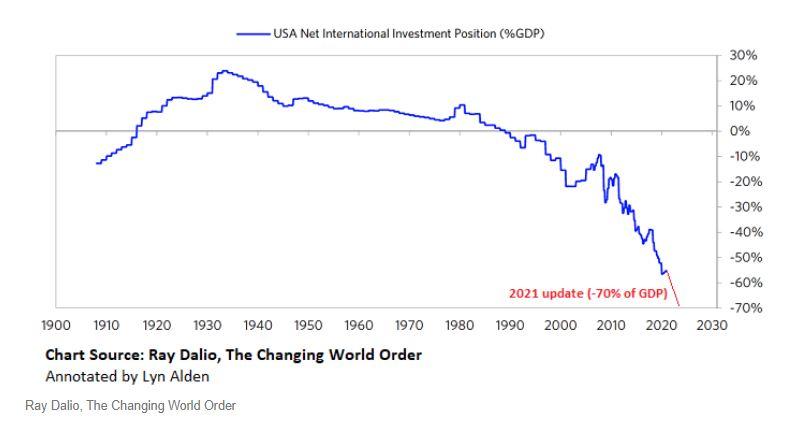
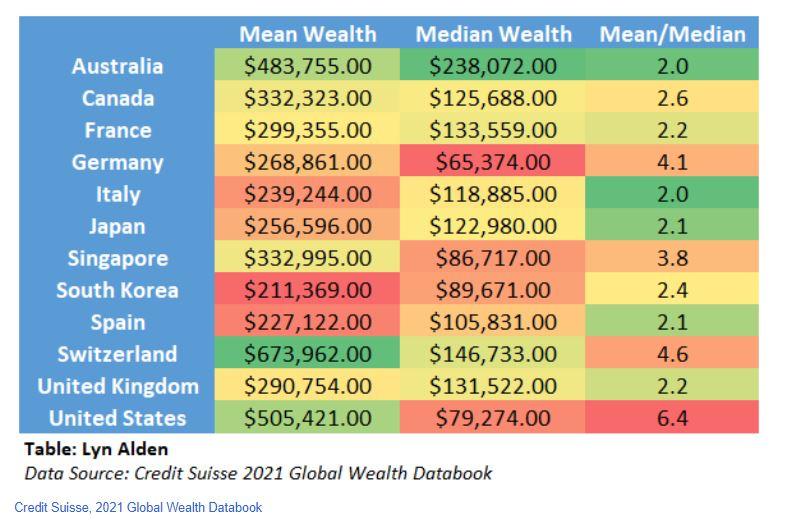
Americans are disproportionally enriched by this system, which allows them to consume more and more, which makes their trade deficit with the rest of the world larger and larger (see Chart 1). The catch is this – the benefits to Americans are not evenly distributed. For the most part they are realized by stockholders, so the wealthiest get ever wealthier. Over time, the U.S. has developed a wealth gap that is more befitting a third world country (see Chart 3). At least somewhat as a result of this, our political system is as fragmented and contentious as it has been since the Civil War. This decade cannot, and I believe will not, just be more of the same, because a rising percentage of younger (and statistically poorer) people don’t believe the systems works for them. As economist Herbert Stein once said, “If something cannot go on forever, it will stop”.
Change is always difficult to forecast. On any given day, odds are that politically, economically, socially, and geologically things will change very little from the previous day. Then there are those days where something snaps and everything changes. In light of the extreme level of imbalances, it seems prudent to begin to invest as though there are alternatives and to use them more actively, rather that wait for market conditions to force this upon us. No one is going to ring a bell to tell investors that the great TINA era is over, but at some point in the future we will all know that it is. As I said in the Outlook, I expect a near term rally off last Friday’s (1/21/22) lows, but I also expect a more difficult decade for investors than the 2010s were.
[1] U.S. Index performance courtesy of S&P 500 via Morningstar Workstation ↩︎
[2] U.S. individual stock performance courtesy of Morningstar Workstation ↩︎
[3] Bond index performance courtesy of Bloomberg via Morningstar Workstation ↩︎
[4] International Index performance courtesy of MSCI Global via Morningstar Workstation ↩︎
Disclosure
Past performance is no assurance of future results. Trademark Financial Management, LLC (“Trademark”) is a registered investment adviser with its principal place of business in the State of Minnesota. Trademark and its representatives are in compliance with registration requirements imposed upon investment advisers by those states in which Trademark operates. Trademark may only transact business in those states in which it is registered or qualifies for an exemption or exclusion from registration. This newsletter is limited to the dissemination of general information pertaining to its investment advisory/management services. Any subsequent, direct communication by Trademark with a prospective client shall be conducted by a representative that is either registered or qualifies for an exemption or exclusion from registration in the state where the prospective client resides. A complete list of all recommendations will be provided if requested for the preceding period of not less than one year. It should not be assumed that recommendations made in the future will be profitable or will equal the performance of the securities in this list. Opinions expressed are those of Trademark Financial Management and are subject to change, not guaranteed and should not be considered recommendations to buy or sell any security. For information pertaining to the registration status of Trademark please contact Trademark at (952) 358-3395 or refer to the Investment Adviser Public Disclosure web site (www.adviserinfo.sec.gov).
For additional information about Trademark, including fees and services, send for our disclosure statement as set forth on Form ADV from us using the contact information herein or by calling 952-358-3395. Please read the disclosure statement carefully before you invest or send money. Any reference to a chart, graph, formula, or software as a source of analysis used by Trademark Financial Management staff is one of many factors used to make investment decisions for your portfolio. No one graph, chart, formula, or software can in and of itself be used to determine which securities to buy or sell, when to buy or sell them, or assist any person in making decisions as to which securities to buy or sell or when to buy or sell them. Any chart, graph, formula, or software used is limited by the data entered and the created parameters. The data was obtained from third parties deemed by the adviser to be reliable. Nonetheless, the adviser has not verified the results and cannot be assured of their accuracy.
Follow-ups and New Thoughts: 1) November Employment Report
The number of jobs created in November (210,000) may have been a disappointment but I believe there are big questions about how that measure accounts for home businesses. Unemployment claims keep falling and the household survey is up over 1.1 million, so that the implication is lots of people are working but not receiving paychecks per se. The upshot is that the evolving narrative of a faster taper has not been negated by the payrolls figure. A faster taper, if it occurs, is most detrimental for high P/E securities. Second tier growth stocks, especially in long dated industries like biotech and fintech where companies are not yet seeing positive cash flow, are faring the worst these days as a result.
2) November CPI
Inflation remained at relatively high levels in November. Core CPI, at 4.9%, is the highest in over 30 years – and, because of the way owners equivalent rent is calculated, might well be understated. Bond yields responded to this information by FALLING! I have to believe that in the days and weeks to come that this move will be reversed; traders might have been braced for even worse numbers.
3) Seasonality
Typically, the stock market does well in November and December. We are usually ramping up out of the September/October economic slowdown and as we approach the new year, analysts start focusing on the next year’s earnings estimates. In the past, positive seasonality has been superseded by negative liquidity developments, as happened in 2000, 2008, 2015, and 2018. We are flirting with that in 2021 too, as the market awaits announcement from the Fed (December 15th) whether the taper timeline will be sped up or not. Again, valuations of growth stocks are sufficiently high such that a negative surprise in this matter would almost certainly be problematic.
4) Biotech on Sale
Perhaps no area of the stock market has done poorer over the last few months than biotechnology. ARK Genomic Revolution is down almost 50% from its early February highs, with the decline accelerating after Labor Day. Clearly the sector got way ahead of itself early in the year as the Covid vaccine showed the promise of mRNA technology and investors believed that many new cures and therapies were on the verge of being revealed. Unfortunately, it hasn’t played out that way. The FDA has so prioritized COVID that other therapies are being ignored for the time being. Investor patience with firms that are currently losing money (as most biotechs do) seems to have run out. Yet it is difficult to believe that this won’t be a leading sector over the next 10-20 years as our understanding of our individual genetic make-ups increases. Buying biotech today looks like the proverbial “catching a falling knife” attempt, but I believe this sector may be a good opportunity for aggressive (but patient) investors.
5) Poor International Stock Performance
We are on the verge of concluding yet another year where the promise of greater returns from outside the U.S. went spectacularly unfulfilled. As of the end of November, the U.S. stock market has edged non-U.S. by a mere 17.3%. Sarcasm intended. Every year it seems like the brightest investment minds note that foreign markets are far cheaper than U.S. markets and thus set to outperform in the year ahead but every year that doesn’t happen. Clearly, other forces are at work. According to Statista, the U.S. represents about 56% of global stock market capitalization. That is actually a higher percentage than 5, 10, 20, and 30 years ago. We have underweighted international stocks from Day 1; our average equity portfolio is about 72% U.S/28% foreign. And yet I still wonder if I shouldn’t have even less overseas exposure until something changes. It doesn’t seem like a country representing about 4.5% of the world’s population should hog the lion’s share of its equity returns year after year, but here we are.
6) Emerging Markets
On the subject of poor international performance, I’m trying to determine whether or not Europe or Emerging Markets are more disappointing. Europe doesn’t grow, while emerging markets grow and then spectacularly collapse, giving all of their investment returns back. Case in point this year is China, which gained 20% from the start of the year to February 17th. From that point, it has surrendered 35%. We can and have reduced our China exposure but the question always comes down to – where do you put it? Some of the fastest growing emerging market countries have stocks that have risen and declined very sharply, such as Argentina’s Mercadolibre and Singapore’s Sea Ltd. India has been on a very strong roll lately, but can that be trusted? One of the odd things about emerging markets is that smaller countries may actually be safer because they tend to stay out of the government’s crosshairs and are less susceptible to the boom-bust of foreign investment.
7) Strength of the US Dollar
In retrospect, a great trade in 2021 would have been to sell all bonds and buy the US dollar ETF (UUP). It has returned 6.35% year to date, surpassing all categories of bonds including TIPs. It yields nothing; one simply receives the difference between the value of the dollar and a basket of foreign currencies. Because the U.S. dollar is the highest quality currency that has at least some yield to it, it continues to attract inflows from foreigners. It is overvalued on a purchasing power parity basis, so when (if) the global economy recovers, you would not want to own it as its long term expected rate of return is the T-bill rate less fund expenses.
8) In FAAMG We Trust
Investors want growth because interest rates are low. Investors want pricing power because inflation is a concern. Investors want quality because tapering will reduce liquidity, meaning companies that need to borrow are more vulnerable. FAAMG (Should it be GAMMA now that Facebook has become Meta?) provides all the things investors want. Plus, one of the fastest growing sectors of the equity market is hedged equity, which is essentially FAAMG with an options overlay. When the tide finally goes out here (and I have no idea when this will happen but it IS inevitable), it may take a decade to work off the overvaluation. Consider the spectacular underperformance of the S&P 500 from 2000 through 2010.
Chart 1: S&P 500 now more concentrated in the 5 largest stocks than ever
Per Morningstar, the S&P 500 was up 23.18 through November versus 5.84% for MSCI EAFE.
Disclosure
Past performance is no assurance of future results. Trademark Financial Management, LLC (“Trademark”) is a registered investment adviser with its principal place of business in the State of Minnesota. Trademark and its representatives are in compliance with registration requirements imposed upon investment advisers by those states in which Trademark operates. Trademark may only transact business in those states in which it is registered or qualifies for an exemption or exclusion from registration. This newsletter is limited to the dissemination of general information pertaining to its investment advisory/management services. Any subsequent, direct communication by Trademark with a prospective client shall be conducted by a representative that is either registered or qualifies for an exemption or exclusion from registration in the state where the prospective client resides. A complete list of all recommendations will be provided if requested for the preceding period of not less than one year. It should not be assumed that recommendations made in the future will be profitable or will equal the performance of the securities in this list. Opinions expressed are those of Trademark Financial Management and are subject to change, not guaranteed and should not be considered recommendations to buy or sell any security. For information pertaining to the registration status of Trademark please contact Trademark at (952) 358-3395 or refer to the Investment Adviser Public Disclosure web site (www.adviserinfo.sec.gov). For additional information about Trademark, including fees and services, send for our disclosure statement as set forth on Form ADV from us using the contact information herein or by calling 952-358-3395. Please read the disclosure statement carefully before you invest or send money. Any reference to a chart, graph, formula, or software as a source of analysis used by Trademark Financial Management staff is one of many factors used to make investment decisions for your portfolio. No one graph, chart, formula, or software can in and of itself be used to determine which securities to buy or sell, when to buy or sell them, or assist any person in making decisions as to which securities to buy or sell or when to buy or sell them. Any chart, graph, formula, or software used is limited by the data entered and the created parameters. The data was obtained from third parties deemed by the adviser to be reliable. Nonetheless, the adviser has not verified the results and cannot be assured of their accuracy.
Summary
While it is technically true that the S&P 500 stock index added 0.58% in the third quarter, it really didn’t feel that way. Small cap U.S. stocks declined, midcap U.S. stocks declined, and foreign stocks declined – both developed and emerging markets. Seven of the largest ten stocks in the U.S. advanced, led by Alphabet, Tesla, and Microsoft, which was enough to turn the major index positive despite most stocks losing ground. For most companies and countries, however, the big news on the quarter was the surge in inflation caused by significant supply disruption, both of goods and of services. The world continues to emerge from the Covid crisis, but mostly in fits and starts. The global economy that is emerging seems to be profoundly different than the one we had before. That said, the Federal Reserve has maintained a very accommodative monetary policy, so enough liquidity exists to allow the market to “tread water” more or less. Inflation may be rising, but companies seem to be able to pass on their higher costs because their customers are in better financial shape. That means corporate profit margins can remain at or near all time highs. Whether one believes Fed policy has been wise or not, this is not the environment in which one should expect a major decline.
The first two months of the third quarter were marked by a concern that the economy was slowing. Utilities, real estate, and communications, three of the most defensive sectors, performed the best while those that are the most economically sensitive – energy, materials, and industrials – lagged. September saw a surge in energy prices amid a pickup in the economy, so the roles reversed. Financial services stocks had the best quarter of all in that very low interest rates promote the “game-ification” of financial markets. With IPOs, mergers, and other financial activities at record levels, there were nice fees for Morgan Stanley, Goldman Sachs, and their peers.
Emerging markets drew most of the attention this past quarter. Everybody was trying to determine whether China was still a reasonable place to invest with all the new regulations imposed by Xi Jinping. China’s -13.34% quarterly return dragged the MSCI All Emerging Markets index to a -8.09% loss. International stocks as a whole were only down -3.02%, because Japan gained 4.56% and Europe and Canada were only modestly lower. The best performing international stocks last quarter were actually in what are known as frontier markets. This encompasses countries in Asia, Africa, South America, and eastern Europe that do not qualify for EM status. Think places like Columbia, Nigeria, Qatar, Austria, and Vietnam.
Bonds were about unchanged last quarter. Yields are very low, but until recently they have been relatively stable. Low prospective returns have led many investors to take the extra risk of high yield corporate, floating rate, high yield municipal, or emerging market debt in order to earn higher income. In all cases but the latter, it paid off during the third quarter. With interest rates rising this quarter, taking that extra credit risk may pay off again this quarter. The risk in doing so is a sudden economic downturn which increases fears of default, but I just don’t see that happening in the near term.
Activity
Because the biggest concern this quarter was emerging markets (China most specifically), that was the area we spent the most time on. We reduced exposure to China either by trimming the overall emerging market weighting or by exchanging to an emerging market fund with a lower percentage of Chinese stocks. One didn’t want to avoid emerging markets altogether, because some countries (India, for example) performed quite well. We also had to address rising inflation and its impact on the bond market. The largest moves were in shorter duration bonds. Short term bond yields are so low that even fairly small interest rate increases can cancel out all the income one receives. We’ve been replacing some of our bond exposure with lower risk securities with less interest rate sensitivity, such as market neutral and convertible arbitrage funds. We’ve also been adding a small amount of commodity exposure to many portfolios. Lastly, we continued to reduce exposure in some of the areas that made us a lot of money in 2020 but have spent most of this year working off over-valuation. Funds (ETFs) focusing on genomics, clean energy, and emerging technologies have struggled this year, so we have reduced our exposure to these more narrowly focused areas.
Outlook
The stock market’s -4.65% decline in September spooked a few people, but we expected a pullback due to the frenetic pace of new highs throughout the summer and the fact that the September to mid-October period tends to be a seasonally weak time for stocks. Fortunately, this October has gotten off to a good start. Increasingly, the market volatility that one associates with October actually occurs in September, so once we get to the start of earnings season in mid-October, we are usually “out of the woods” so to speak. We can’t predict exactly when the market will get over its September funk in any given year, so we tend to avoid seasonal trading. That said, we were not at all surprised when stocks made new all-time highs on October 21st.
We believe that earnings season will continue to provide a boost to most stocks as corporate profit margins remain at or near record levels. The next period of caution will arrive right before the Federal Reserve meeting on November 2-3. The Fed is expected to announce a modest tapering in bond purchases, which would remove some of the very ample liquidity from the market. An announcement of a greater than expected tapering would almost certainly adversely affect both stocks and bonds, but Chairman Powell seems keen not to roil the markets the way he did in late 2018.
Commentary – It’s What You Know For Sure That Just Ain’t So
Mark Twain had a number of wonderful and witty sayings. “Kindness is a language which the deaf can hear and the blind can see”, and “God created war so that Americans would learn geography” are two of my favorites. His quote, “It ain’t what you don’t know that gets you into trouble, it’s what you know for sure that just ain’t so” is probably the one with most relevance to investors. Twain seems to have understood overconfidence bias some 80 years before Daniel Kahneman and Amos Tversky won a Nobel Prize for analyzing people’s behavioral biases. In the thirty-five years since I started in the financial services industry (yes, in 1986) nothing has cost people more money than the attempt to sidestep market declines because they just knew that the market was about to go down.
I am not saying that timing the market is impossible because that is obviously not true – those who try are occasionally successful. Great market calls are so rare though that we tend to remember the names of the very few who made them. Jesse Livermore, Elaine Garzarelli, and Michael Burry come to mind. I am instead saying that market timing is a low probability exercise. Selecting both a favorable time to exit and then an auspicious time to re-enter the market is very difficult. Despite more than a century of attempts, nobody has found an indicator robust enough not to give false signals timely enough to warn you before the market is already down more than 10%. Professionals talk about “batting average” because they know NOBODY gets every trade right. Non-professionals often believe that there are those who get all the big moves right, because the advertisements on the internet tell them so.
One of the worst mistakes non-professionals make is believing that the fate of markets lies with who is in the White House. The fact of the matter is that stock performance depends primarily on corporate profits (both current and expected), the future rate of inflation (because inflation reduces the value of a dollar earned in the future), and the amount of liquidity provided by the Federal Reserve that companies, investors, and speculators may use to leverage up their return. For example, Apple Inc. generates billions of dollars in free cash flow every quarter. It does not need to borrow money in the bond market to fund its operations, but it does so anyway in order to buy back some of its shares. This increases the reported earnings per share because Apple’s growth rate is higher than it’s cost of borrowing. If the Fed holds borrowing costs low enough, even very mediocre companies with much lower returns on capital can take advantage of this form of arbitrage. That is what we are seeing today. It’s gone on since the Great Financial Crisis, and it has largely contributed to the twelve-year bull market that began in March 2009. Presidents do not control how much liquidity is in the economy, at least not directly, therefore they tend to get too much credit or blame for stock market movements. Companies focus on serving their customers and growing their businesses, regardless of who is in the White House. No particular policy of the Biden administration, the Trump administration, or the Obama administration before that was the catalyst responsible for the bull market.
There is an old saying on Wall Street – “the trend is your friend until the bend at the end”. This is a clever way of saying that all trends, including this one, will eventually end, but the smart money respects it and doesn’t constantly try to “front run” the ending. Bull markets do not end because prices get too high, rather they die because the fuel that propelled them to the high prices has been exhausted. Leverage is wonderful on the way up but disastrous on the way down. Knowing this forces us to carefully watch liquidity conditions, inflation, and corporate profit margins to get a hint at when we might shift to a more defensive posture. Not because we think we can avoid the next market crash, but that we may be less exposed when one does come.
Mark Twain also wrote: “October: This is one of the peculiarly dangerous months to speculate in stocks. The others are July, January, September, April, November, May, March, June, December, August, and February”. Humor aside, every day we think hard about what might go wrong and how this bull market may end. Stocks are by almost every measure quite expensive, inflation appears to be on the rise, and at some point the Federal Reserve will not be able to be this accommodative. That said, the bull market has overcome many challenges over the past several years and has therefore earned the benefit of the doubt. That is we try very hard not to let our concerns cause us to give up a meaningful amount of return potential.
One thing I’ve learned is that all large market declines start out as little market declines, but the vast majority of little market declines do not turn into crashes. Crashes happen when the initial problem is not handled right. You can’t predict policy errors or market panic in advance.
S&P 500 performance from Standard & Poor’s via Morningstar
Sector performance information via JPMorgan
Foreign stock performance from MSCI International (Morgan Stanley), via Morningstar
S&P 500 return, again courtesy of Standard and Poor’s.
Disclosure
Past performance is no assurance of future results. Trademark Financial Management, LLC (“Trademark”) is a registered investment adviser with its principal place of business in the State of Minnesota. Trademark and its representatives are in compliance with registration requirements imposed upon investment advisers by those states in which Trademark operates. Trademark may only transact business in those states in which it is registered or qualifies for an exemption or exclusion from registration. This newsletter is limited to the dissemination of general information pertaining to its investment advisory/management services. Any subsequent, direct communication by Trademark with a prospective client shall be conducted by a representative that is either registered or qualifies for an exemption or exclusion from registration in the state where the prospective client resides. A complete list of all recommendations will be provided if requested for the preceding period of not less than one year. It should not be assumed that recommendations made in the future will be profitable or will equal the performance of the securities in this list. Opinions expressed are those of Trademark Financial Management and are subject to change, not guaranteed and should not be considered recommendations to buy or sell any security. For information pertaining to the registration status of Trademark please contact Trademark at (952) 358-3395 or refer to the Investment Adviser Public Disclosure web site (www.adviserinfo.sec.gov). For additional information about Trademark, including fees and services, send for our disclosure statement as set forth on Form ADV from us using the contact information herein or by calling 952-358-3395. Please read the disclosure statement carefully before you invest or send money. Any reference to a chart, graph, formula, or software as a source of analysis used by Trademark Financial Management staff is one of many factors used to make investment decisions for your portfolio. No one graph, chart, formula, or software can in and of itself be used to determine which securities to buy or sell, when to buy or sell them, or assist any person in making decisions as to which securities to buy or sell or when to buy or sell them. Any chart, graph, formula, or software used is limited by the data entered and the created parameters. The data was obtained from third parties deemed by the adviser to be reliable. Nonetheless, the adviser has not verified the results and cannot be assured of their accuracy.
Follow-ups and New Thoughts:
So little happened this summer that every time I sat down to write about the concern of the moment, it quickly faded and the market made new highs. I do think the current environment merits some commentary, however:
1) The current stock market high close, 4532, was recorded on September 2nd. From there to the October 4th close of 4286 was a decline of 5.4%. For the S&P 500, the current decline is the largest so far this year. Declines of more than 3% but less than 5% occurred in the 4th week of January, the last two weeks of February, the second week of May, the third week of July, and of course more recently. Dips of slightly less than 3% occurred in March (3rd week) and June (3rd week). Short declines are frequent. They only become a concern when the market cannot rally from the bottom to new highs. One should never react to an initial decline; only get concerned when there is no meaningful buying of the dip and the market rolls over and falls below the previous low. We are below the 50-day moving average, but we also did that in March and June, and in September and October of 2020. I don’t expect that significant selling would begin unless we crossed the 200-day moving average, which is around 4200. We didn’t even touch that level intraday yesterday, October 4th. I believe history is still on the side of “buy the dip”.
2) One of the other indicators I like to monitor is the high yield bond index, especially the CCC-AAA yield spread. Though the spread has widened lately, it is still lower (6.59%) than it was on August 23rd (6.63%). Bonds do not see danger coming. (This spread exploded between February 21st and February 28th, 2020).
3) Switching gears to emerging markets: Sure, emerging markets are oversold. Unfortunately, that has been the case for most of the last 13 years. The simple fact is that emerging markets don’t perform well (in dollar terms) while the dollar is rising. The currency hedged EM ETF (ticker: HEEM) has trounced the EM benchmark since its 2014 launch. The current period of dollar strength suggests that while EM (especially China) might have an oversold bounce in the near term, there will be no major rally unless and until currency stops being such a headwind.
4) China’s private sector crackdown this year might seem bizarre, or at least counter-productive given the growth that their major companies (Tencent, Alibaba, etc.) have brought to China over the past 10 years. A casual observance of the current U.S. Senate hearings on Facebook should start to make Chinese actions a little clearer. The United States has basically said that its government either cannot or will not support its people against a company with harmful technology. China is saying it absolutely will. I am dubious about the wisdom or eventual success of telling people what they are allowed to know or do and how they should live, indeed “pro-social” (as China deems its actions) is obviously in the eye of the beholder. That said, I am sure that the Chinese Communist Party looked at the role of Facebook, Google, Twitter, and other American companies in the spread of lethal misinformation leading to all kinds of social dysfunction and told themselves, “whatever mistakes we might make, we are not letting that happen here.”
5) India’s 3-year return exceeds that of the U.S. George Friedman of Geopolitical Insight points out that there have been 30-40 year cycles in which an emerging market country comes to dominate low cost production for the world until its rapid growth drives its costs to where it could no longer fulfill that role. At that point, it needs to change its economic model toward domestic consumption, which is generally a difficult process. The U.S. from 1890 to 1930, Japan from 1950 to 1990, and China from 1990 to last year embody this. Is it India’s time to step in?
6) Switching to inflation: The 10-year Treasury yield bottomed at 1.17% on August 2nd. Its current surge to 1.53% is not enough to derail the stock market, but it is enough to prompt a modest shift from growth to value. This happens because value stocks are more a play on current earnings and assets whereas growth stocks derive most of their value from future cash flow. The proximate cause of the upturn in rates was an uptick in oil prices and the belief that the Federal Reserve will begin to taper its bond purchases by the end of this year.
7) Inflation is both a measure and a mindset. The market only has a problem when inflation becomes a mindset. In other words, when people change their behavior on the belief that they need to keep up with rising inflation. Surveys done by the NY Fed and the University of Michigan suggest this is happening. Supply chain disruptions happen all the time, so they have to persist for quite a while before people stop dismissing them as being temporary. We appear to be at that point. Wages are rising too, as employees want a bigger slice of the pie and companies know they can pass this cost on to their customers.
8) The final part of the inflation story is commodity prices. Goldman Sachs suggests that the case for cyclical stocks – materials, chemicals, energy, etc. – is becoming a structural because of chronic under-investment in productive capacity. Long bear markets in commodities cause the companies in these sectors to scrap capacity and delay upgrades and repairs. As demand returns, companies are temporarily unable to meet it, driving prices way up. As capacity returns, investors anticipate the next down cycle and they bail out. Most investors avoid these situations because the window to make money is often very short (months, not years). Increasingly, investment houses are calling for this cycle to be protracted because the ability to ramp up capacity is being held back for a variety of reasons. Carefully, I believe that investors should build commodity exposure.
As measured by the S&P 500
The NASDAQ has had declines of 11.5% and 7% in February and May, respectively. Its current decline is 7.8%.
The CCC-AAA spread is a measure of the extra yield bond buyers demand for the risk of holding CCC-rated debt, which has a not insignificant risk of defaulting.
As shared with John Mauldin in his Over My Shoulder report, October 2, 2021
Cyclical means a year or so, structural means 3-5 years or longer.
This is so much harder than growth stock investing, what has become “buy a platform company and take a long nap as it inexorably rises”.
Disclosure
Past performance is no assurance of future results. Trademark Financial Management, LLC (“Trademark”) is a registered investment adviser with its principal place of business in the State of Minnesota. Trademark and its representatives are in compliance with registration requirements imposed upon investment advisers by those states in which Trademark operates. Trademark may only transact business in those states in which it is registered or qualifies for an exemption or exclusion from registration. This newsletter is limited to the dissemination of general information pertaining to its investment advisory/management services. Any subsequent, direct communication by Trademark with a prospective client shall be conducted by a representative that is either registered or qualifies for an exemption or exclusion from registration in the state where the prospective client resides. A complete list of all recommendations will be provided if requested for the preceding period of not less than one year. It should not be assumed that recommendations made in the future will be profitable or will equal the performance of the securities in this list. Opinions expressed are those of Trademark Financial Management and are subject to change, not guaranteed and should not be considered recommendations to buy or sell any security. For information pertaining to the registration status of Trademark please contact Trademark at (952) 358-3395 or refer to the Investment Adviser Public Disclosure web site (www.adviserinfo.sec.gov). For additional information about Trademark, including fees and services, send for our disclosure statement as set forth on Form ADV from us using the contact information herein or by calling 952-358-3395. Please read the disclosure statement carefully before you invest or send money. Any reference to a chart, graph, formula, or software as a source of analysis used by Trademark Financial Management staff is one of many factors used to make investment decisions for your portfolio. No one graph, chart, formula, or software can in and of itself be used to determine which securities to buy or sell, when to buy or sell them, or assist any person in making decisions as to which securities to buy or sell or when to buy or sell them. Any chart, graph, formula, or software used is limited by the data entered and the created parameters. The data was obtained from third parties deemed by the adviser to be reliable. Nonetheless, the adviser has not verified the results and cannot be assured of their accuracy.
Summary
Stocks maintained their strong advance in 2021 by adding another 8.55% last quarter. Technology, Energy, and Real Estate led the way. Economically, that makes little sense – technology, as a long-dated asset, should benefit from disinflation while energy (a cyclical) should respond to economic strength and higher inflation. The Telecom and Utility sectors are usually viewed as defensive because people generally don’t use less electricity or phone service during a recession. Here too performance varied widely; telecoms rose 10.72% last quarter while utilities lost 0.41%. Rather than flowing in one particular direction in response to a coherent Federal Reserve policy, money in the market is sloshing around haphazardly. Attributing any given day’s results to a particular concern, such as COVID or China or inflation, is giving traders way too much credit.
Source: JPM Guide to the Markets 3Q 2021. The Fed’s balance sheet expansion lifts stocks after the Great Financial Crisis and again after the COVID Crisis
The Federal Reserve continues to pump money into the financial system by buying bonds. This is depressing yields, forcing income-seeking investors to opt for riskier securities if they do not want to settle for historically low yields. All of the Fed’s buying doesn’t do bond investors much good in the long run. A decade of central bank bond buying has all but ensured that inflation levels will exceed the yields of high quality bonds. Today, the bond market yields less than 2%. Given that inflation is currently around twice that, bond investors receive about a -2% annual return in purchasing power terms. Even without factoring in inflation, the U.S. Aggregate Bond Index has delivered a -1.60% loss through the first half of 2021. Some bond investors have migrated to riskier high yield “junk” bonds which have returned 3.62% so far this year, while others have embraced dividend paying stocks. One hopes they remember that in the last real bear market (2007-09) quality bond losses tended to be well under -10% (in fact long treasuries actual rose), while high yield bonds and dividend paying stocks each lost more than a third of their value. The market has an expression for taking large risks to obtain modest returns – picking up pennies in front of a steamroller. That pretty much sums it up.
Switching to foreign markets, foreign stocks were again rather subdued compared to the U.S. Developed foreign markets gained 5.69% and emerging markets rose 6.08%, according to S&P Dow Jones. Both indices are up less than 10% year to date. Japan has been notably weak, while Canada has strung together two straight quarters of 10% plus gains on the strength of soaring lumber and energy prices. China’s crackdown on its technology leaders has been a drag on Asian and emerging market indices because these stocks are some of the largest components.
Gold has had a rough half year so far as the dollar has been strong, but commodities in general have been having one of their best years in a decade. Energy and agricultural commodities have led the way. With inflation posting some of its strongest numbers in years, this area has become more interesting to us. We are looking at ways to hedge inflation that don’t involve gold or inflation-indexed bonds.
Activity
There was not as much trading activity this quarter, as the narrative driving both the bond and stock markets remained largely unchanged. We review portfolios on an ongoing basis to see if there are any funds or ETFs that are underperforming such that we could replace them with better performing alternatives and not expose the portfolio to greater concentration risk. At the margin we have reduced the weighting in cash and bonds and increased the percentage allocated to stocks, but we are conscious that we (and the market as a whole) have been forced to pay ever higher prices for the hope of future returns. Steamroller indeed.
There has been a very sharp correction in the more aggressive sectors of the market – cryptocurrencies and cutting-edge industries like electric vehicles, genomics, financial technologies, and cloud-based consumer technologies. We don’t have much exposure to these areas, but to the extent that we do, we are riding it out. One must expect a much higher level of volatility if one hopes for significantly greater return. Again, money moves in and out of these stocks so fast that a tactical approach (timing) just doesn’t work.
Outlook
From time to time, there will be “corrections”. Volatility is a part of investing, such that if you aren’t comfortable with the occasional 5%-10% decline, perhaps you are more of a saver than an investor. That said, once a decade or so the stock market undergoes a more significant decline (30% or more) usually tied to either a sharp fall in economic output or a sharp rise in costs (inflation). Ex-post, market corrections associated with either of those causes may be correlated with an inverted yield curve or an abnormal advance-decline ratio. On the other hand, the “crashes” of March 2020 and October 1987 fall into the category of event-driven sell-offs, where one does not get much of an early warning.
Investing can be broken down into macro (asset allocation) and micro (individual security selection). Much of the macro part of investing is trying to identify those times in which the risk of a more significant decline is elevated. When those conditions are present, investors should re-assess their asset allocation. Most of the time that risks are elevated the market will undergo a modest correction but then the upward trend will promptly re-establish itself. In these cases, taking no action will have been the better strategy. The longer the market goes without a major decline, however, the more valuation and sentiment can get way out of whack and the odds of a major market event rise. Theoretically, the sharp plunge sixteen months ago should have put us in a place where we would not have to worry about excess speculation for several years. As we all know, however, speculation has come back with a vengeance. Stock prices have about doubled off their March 23rd low.
The stock market doesn’t peak because valuations reach 20 times earnings or 18 times sales or 5 times book value or any other accounting metric. Instead, markets peak when investors begin to worry that they won’t be able to find other investors to sell to at higher prices. Therefore, it is important to be able to sense when the market (or a segment of it) is approaching its saturation point. As I stated above, we appear to have reached that point earlier this year with Bitcoin and other cryptocurrencies and with companies that fit the “disruptive technologies” description. Hopefully that is all the correction we will get for now, but I find it difficult to believe that we are going to get off that easy. That said, we have not yet positioned our portfolios for a more serious decline. Risk on, but watching closely.
Commentary
When I started in the financial services industry in 1986, the Federal Reserve was in the process of bringing interest rates down from the mid-teens. It had been necessary to hike rates to 16% or so back in 1981 in order to crush inflation. By 1986 rates had fallen to around 10% as inflation retreated into single digits. The Fed never seemed to be able to go two straight meetings without changing the discount rate, because fears of returning inflation seemed to conflict with fears of economic slowdown. This tug of war served active investors very well – if you could correctly anticipate the Fed’s next move in time to position yourself accordingly, you could expect to make a greater-than-market-return profit. The dynamism of interest rates and the business cycle drove investment decision.
Today everything is different. The Federal Reserve is basically stuck on zero percent. There is no business cycle to speak of, because the Fed is trying (through its open market activities) to maintain a perpetual state of early-to-mid cycle. This encourages a more passive approach to investing. If you imagine a bathtub where the Fed is filling the tub while investors thrash around like a three year-old, active investing is essentially betting on which areas of the tub will see higher or lower water levels, while passive investing is betting on the overall water level. Since the 2007-09 financial crisis, a succession of Fed governors have made the latter virtually a slam dunk.
In this environment, very few major companies ever go bankrupt relative to 30 or 40 years ago because interest rates are much lower and most companies of any size have access to credit. Of course, their stock and bond prices have risen to reflect their much lower degree of economic risk. The problem is, if the Fed ever stops pumping money into the economy through the purchase of government and corporate debt, interest rates are likely to rise. This means credit won’t be as easy to obtain and more companies will fail and therefore risk premiums will have to rise. In other words, stock and high yield bond prices will fall. If you recall, the Fed tried to end this process back in October 2018 and the 4th quarter of that year was rather ugly for investors.
Why, you might ask, would the Fed ever stop pumping liquidity into the market if doing so would cause a market decline? One reason is that not everybody in an economy is an investor. Some only have the means to be a saver. Because the Fed is keeping interest rates artificially low, savers get less interest than they should. In essence, savers are subsidizing investors. This helps increase wealth inequality across classes, and history suggests that rising wealth inequality ultimately does not end well. At some point (probably during the next recession), the idea of stimulating the economy through Fed purchases is likely to become politically unpopular (the bottom 50% of the income spectrum owns such a tiny percentage of the stock market that it’s almost impossible to perceive on a line graph).
Things have changed a lot over the past 40 years. The way one reads the market and the tactics one uses to maximize return for a given level of risk have certainly changed. As a result, our methods have evolved to the use of more passive vehicles like ETFs and now, rather than anticipate the Fed’s next move, we start from the default position that the Fed is not going to change its tactics unless it absolutely must. That day will come, but it is not going to be tomorrow and it is probably not going to be for quite a while. When it comes, advisors and investors will face a new environment and new tactics will have to de devised. It is our mission to guide you through that as smoothly as we can.
Meaning that almost all potential buyers are already in.
Incidentally, I am not worried about the stock market effects of a resurgence of COVID. I do not foresee the country shutting down like it did last year. America has collectively decided that it is going to stay open and deal with the consequences.
Per S&P Dow Jones Indices
1.97% as of Today per YCharts (Vanguard Total Market Bond ETF)
It’s even worse if you own CD’s that yield 1% or less
S&P Canada Broad Market Index Total Return in US dollars, per Morningstar Workstation
Disclosure
Past performance is no assurance of future results. Trademark Financial Management, LLC (“Trademark”) is a registered investment adviser with its principal place of business in the State of Minnesota. Trademark and its representatives are in compliance with registration requirements imposed upon investment advisers by those states in which Trademark operates. Trademark may only transact business in those states in which it is registered or qualifies for an exemption or exclusion from registration. This newsletter is limited to the dissemination of general information pertaining to its investment advisory/management services. Any subsequent, direct communication by Trademark with a prospective client shall be conducted by a representative that is either registered or qualifies for an exemption or exclusion from registration in the state where the prospective client resides. A complete list of all recommendations will be provided if requested for the preceding period of not less than one year. It should not be assumed that recommendations made in the future will be profitable or will equal the performance of the securities in this list. Opinions expressed are those of Trademark Financial Management and are subject to change, not guaranteed and should not be considered recommendations to buy or sell any security. For information pertaining to the registration status of Trademark please contact Trademark at (952) 358-3395 or refer to the Investment Adviser Public Disclosure web site (www.adviserinfo.sec.gov). For additional information about Trademark, including fees and services, send for our disclosure statement as set forth on Form ADV from us using the contact information herein or by calling 952-358-3395. Please read the disclosure statement carefully before you invest or send money. Any reference to a chart, graph, formula, or software as a source of analysis used by Trademark Financial Management staff is one of many factors used to make investment decisions for your portfolio. No one graph, chart, formula, or software can in and of itself be used to determine which securities to buy or sell, when to buy or sell them, or assist any person in making decisions as to which securities to buy or sell or when to buy or sell them. Any chart, graph, formula, or software used is limited by the data entered and the created parameters. The data was obtained from third parties deemed by the adviser to be reliable. Nonetheless, the adviser has not verified the results and cannot be assured of their accuracy.
Follow-ups and New Thoughts: 1) On July 7th the 10-year Treasury traded at less than 1.30% for a short time before closing near 1.32%. Some of the factors behind the decline are:
Reduced expectations for 2022 and 2023 growth
Systematic buying by the U.S. Treasury and insurance companies – the former due to the ongoing QE program and the latter practicing asset re-allocation following a period of strong equity returns and weak bond returns.
Capitulating short sellers. Inflation may or may not be transitory, but if you get into a crowded trade and it starts to move against you, it doesn’t matter whether or not you will be proven right in the long term. Another thing to watch is the Federal Reserve meeting on June 16th. This may give us guidance as to whether the Fed has begun real discussions on eventually tapering their bond purchases. Similar talk roiled the stock market back in the fall of 2018.
2) June tested us with a disappointing May jobs report early in the month and then an awkward Fed meeting in the middle of the month, yet it finished on a high note. July has a much more favorable historical win rate. There hasn’t been a major stock market top in July in a very long time.
3) High yield bond yield spreads are the lowest since 2007. Until very recently, lower quality credits outperformed despite Treasury yields falling, but investors should know that they are not being adequately compensated for the risks they are taking. With inflation rising well over 2%, however, that statement could be made about most bonds. If you look to CCC rated bond spreads for a sign of impending economic stress, you will not find it. This is why I believe the decline in bonds yields is not a reflection of investor fears about economic weakness, but rather due to the aforementioned technical factors.
4) Emerging markets as a whole have been among the worst places to invest lately, largely because of the Chinese crackdown on internet firms, but also because of poor responses to COVID and some moderation of commodity prices. That said, Taiwan, India, South Korea, and Brazil are doing quite well. Index performance shows the overwhelming influence of China on the benchmark. It also suggests, given that the Vanguard EM Index ETF is in the 51st percentile YTD and the 62nd percentile on a 10-year basis (per Morningstar), that this area still lends itself to active management. 5) Cryptocurrencies’ price peak coincided exactly with the IPO of Coinbase back on April 14th. Could the coming IPO of Robinhood mark the top for meme stocks? Or perhaps for stocks in general? Just a thought.
6) Municipal bonds have had a great rally on the back of tax increase concerns, but their valuations have reached lofty levels. Anecdotally, many fund managers have turned cautious on that space. Some are even increasing exposure to taxable munis.
7) I think the market consensus is right about the economy slowing but wrong about the extent to which inflation will be “transient”. Many goods prices are volatile and respond to temporary supply disruptions. Markets have been correct over the past 20 years to ignore hurricane-related lumber and energy surges as transitory, so that appears to be the playbook investors are working from. This time, however, we are seeing labor shortages that so far seem to be difficult to remedy simply by temporarily raising wages. Rising costs are being more easily passed on in the prices of goods and services than at any time since the 1980s. Neither stocks nor bonds are priced for an environment of slowing economic growth yet stubbornly above trend price increases. We better hope this stagflation (obviously at a lower level than what we experienced in the late 1970s) does not take hold.
Finally, two charts and related thoughts:
Figure 1: Real S&P Composite: 1871-Present with P/E10 Ratio
Source: Advisor Perspectives
At 170% above the long-term regression line, stock prices are extremely expensive on a historical basis. It can take a long time for valuation peaks to fall back to the trend line, but they always have. None of us know how long we have until a great reversion begins, but any investor with less than a 15-year time horizon really needs to take this into consideration.
The second chart shows how much investors have shoved into equity markets this year so far. As equity exposure as a percentage of one’s investment assets passes the roughly 62% level peak of the late 1960s and again in early 2000, one should consider how confident we should be that we can continue to defy history.
Figure 2: Equity Fund Flows
Source: SentimenTrader.com
Disclosure
Past performance is no assurance of future results. Trademark Financial Management, LLC (“Trademark”) is a registered investment adviser with its principal place of business in the State of Minnesota. Trademark and its representatives are in compliance with registration requirements imposed upon investment advisers by those states in which Trademark operates. Trademark may only transact business in those states in which it is registered or qualifies for an exemption or exclusion from registration. This newsletter is limited to the dissemination of general information pertaining to its investment advisory/management services. Any subsequent, direct communication by Trademark with a prospective client shall be conducted by a representative that is either registered or qualifies for an exemption or exclusion from registration in the state where the prospective client resides. A complete list of all recommendations will be provided if requested for the preceding period of not less than one year. It should not be assumed that recommendations made in the future will be profitable or will equal the performance of the securities in this list. Opinions expressed are those of Trademark Financial Management and are subject to change, not guaranteed and should not be considered recommendations to buy or sell any security. For information pertaining to the registration status of Trademark please contact Trademark at (952) 358-3395 or refer to the Investment Adviser Public Disclosure web site (www.adviserinfo.sec.gov). For additional information about Trademark, including fees and services, send for our disclosure statement as set forth on Form ADV from us using the contact information herein or by calling 952-358-3395. Please read the disclosure statement carefully before you invest or send money. Any reference to a chart, graph, formula, or software as a source of analysis used by Trademark Financial Management staff is one of many factors used to make investment decisions for your portfolio. No one graph, chart, formula, or software can in and of itself be used to determine which securities to buy or sell, when to buy or sell them, or assist any person in making decisions as to which securities to buy or sell or when to buy or sell them. Any chart, graph, formula, or software used is limited by the data entered and the created parameters. The data was obtained from third parties deemed by the adviser to be reliable. Nonetheless, the adviser has not verified the results and cannot be assured of their accuracy.