

The second quarter of 2026 was nothing short of eventful. From global rebound in stocks, initially fueled by a temporary peace deal with Iran, to Warsh taking office and expressing a hawkish tilt in his very first press conference, to the long-awaited SpaceX IPO that sparked a frenzy among retail investors, this quarter had it all. Volatility was certainly not scarce, and it left a lot of investors with more questions than answers as we continue down this road of record highs, sticky inflation, and an AI boom that now seems to touch nearly every corner of the market.
Equity Rally Led by Semiconductors
After a rocky first quarter, equities came roaring back in Q2 as investors put the U.S.-Iran conflict in the rear-view mirror. The S&P 500 clawed its way back to a strong +14.10% for the quarter, followed by developed international markets at +10.90%, while emerging markets outpaced both and returned +18.79%. The biggest storyline of the period was semiconductors, with the group up a staggering +67.33% (ticker SMH), enough to carry the broader Technology sector to a +41.39% quarter. For much of this bull market, returns leaned heavily on a narrow set of mega-cap names, which left index investors more concentrated than many realized. This quarter, the gains finally started to spread out. As the chart below shows, small-caps (+19.08%) actually outpaced the S&P 500, with similarly encouraging results from mid-caps. This double-digit quarter for the pair has a few forces behind it: AI infrastructure spending trickling down to smaller suppliers, a lingering tailwind from December’s rate cut, and, biggest of all, a market rotation away from the crowded mega-cap tech trade. That broadening didn’t get nearly the attention it deserved, but it’s exactly the kind of participation that historically points to a healthier and more durable market advance. We remain prudently optimistic heading into the next quarter.
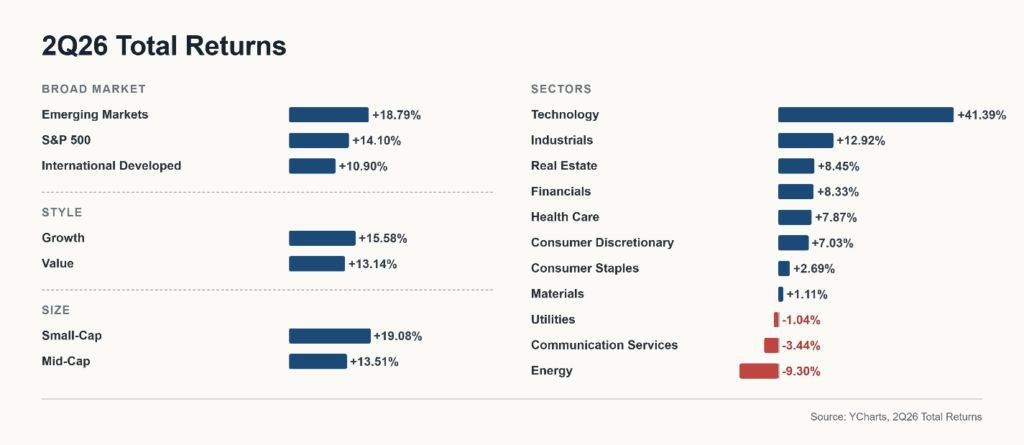
Source: YCharts, Total Returns (4/1/2026 – 6/30/2026)
Gold Gives Back
While equities made quite the reversal, gold and other precious metals did the opposite. Gold posted a sharp decline of -16.23% for the quarter, ending just above $4,000 an ounce. After setting all-time highs at the end of January, the metal has continued to trend lower. Some of that is simple profit-taking, between both retail and institutional investors, which is no surprise given that gold just went through one of the biggest run-ups in its history. The other key variable was commentary from newly appointed Fed Chair Kevin Warsh, whose committee removed its 2026 rate-cut projection while leaning into a higher-for-longer stance. Higher rates are generally a headwind for non-yielding assets like gold, since holding it means giving up the interest an income-producing asset would pay. Even though gold fell hard, it did so in the very quarter equities surged back, a reminder that diversification often works quietly in the background, just in this case it was in the direction investors tend to forget. Our view on gold hasn’t changed with this recent price decline. We believe the structural case for owning gold and other hard assets remains intact, supported by continued geopolitical fragmentation, accelerating deglobalization, an expanding money supply, and more that we will get into another time. A recent survey by Bank of America, shown below, found that global fund managers view gold as undervalued for the first time in more than three years, which means this pullback just may prove to be a healthy reset in a longer-term story.
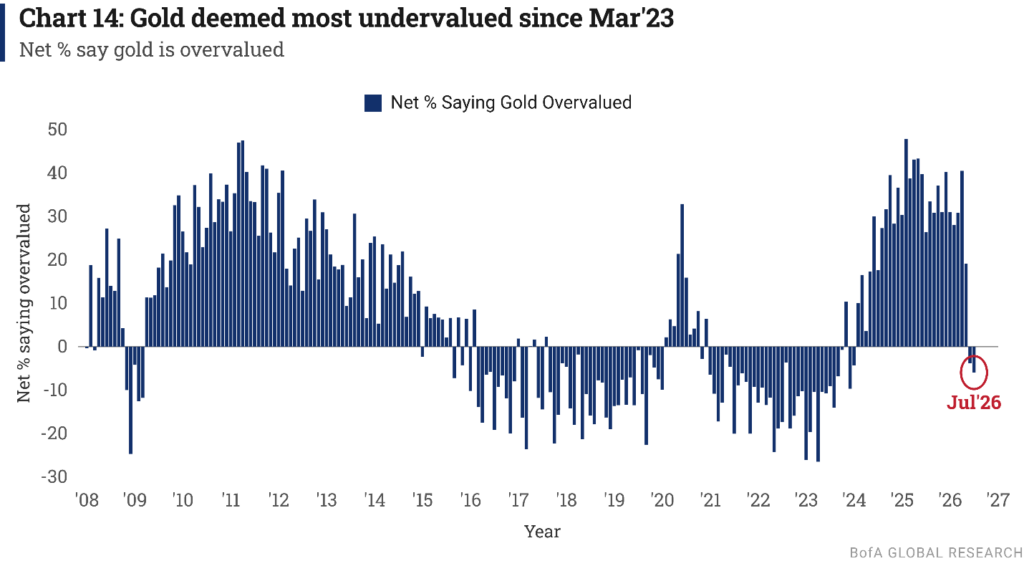
Source: BofA Global Fund Manager Survey
Warsh Comes in Hawkish
The next headline to make the list was the newly appointed chair, Kevin Warsh, who was sworn in on May 22, succeeding Jerome Powell as the 17th chairman of the Federal Reserve. Warsh made his debut at the June 17 meeting, and the rate decision itself was not much of a surprise, a unanimous hold at 3.50% to 3.75% even as May inflation crept back up to 4.2% year-over-year. What mattered more was everything that happened around it. Warsh wasted no time signaling change, communicating the decision in roughly 130 words and stripping out any language that hinted at the future path of rates. He is taking a clearly differentiated approach to the job, eliminating forward guidance, launching five new internal task forces to rethink how the Fed operates and communicates, and making plain he has little appetite for higher inflation going forward. While Warsh declined to submit a ‘dot’ of his own, the rest of the committee did, and several officials penciled in at least one rate hike this year. Historically, markets have often seen added volatility following a change at the top of the Fed, and the chart below lays out the drawdowns past chairs faced in their first three months on the job. History doesn’t always repeat, but it often rhymes. So far, though, the S&P 500 has held up, sitting roughly flat since Warsh’s first day.
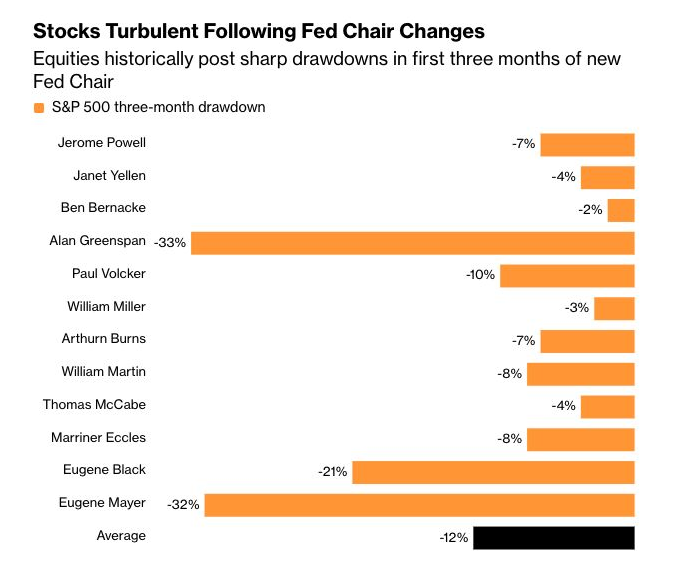
Source: Barclays, Bloomberg
The Largest IPO in History: SpaceX
One of the quarter’s final headlines was the record-breaking debut of Elon Musk’s SpaceX. On June 12, the company went public at $135 per share, raising roughly $75 billion and entering the market at a valuation near $1.8 trillion, the largest IPO in history. To put the scale in perspective, SpaceX’s exit value is estimated to exceed the combined exit value of every IPO over the past decade, as the chart below shows. The frenzy was hard to miss, and odds are that at least one person in your life brought it up. We understand the valuation debate and the volatility that followed, but what does SpaceX actually do? Its business runs across three segments: Starlink, the satellite-internet arm and only consistently profitable unit, is the primary revenue driver; the launch business, the rockets, arguably carries the highest long-term upside; and its AI infrastructure arm rounds out the mix. Beneath the excitement, the debut played out the way these things usually do. The stock popped, retail piled in, and the hype began to unwind. Shares ran to an all-time high of $225.64 on June 16 before sliding hard into quarter-end, another reminder that even the largest IPO in history is no match for basic investor behavior. None of that means the stock won’t reward shareholders over time, but it is a familiar setup we have seen before. This is a genuinely remarkable company, one with the potential to drive technological breakthroughs unlike anything in our lifetimes, and for that reason it is best approached with a long-term mindset.
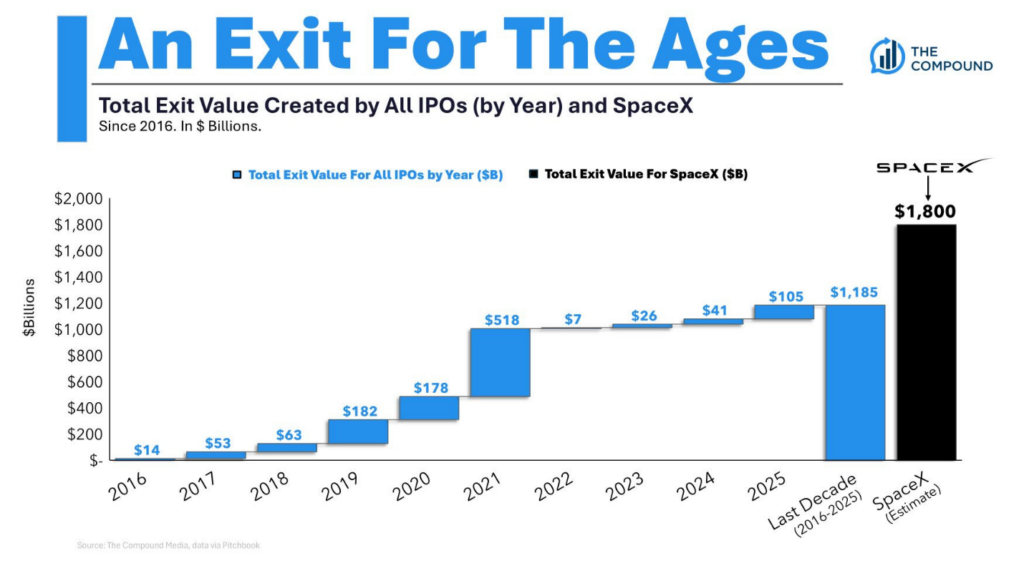
Source: The Compound Media, data via Pitchbook
$765 Billion and Counting
The number above is the baseline estimate for capital expenditure, or capex, spending in 2026. This capex story is the connective tissue for the entire post, since nearly everything we’ve covered is shaped in one way or another by the enormous sums being poured into this buildout. And it isn’t just a 2Q26 story. It looks poised to be a recurring theme for years, with estimated spending set to keep ramping over the next five years, as the chart below lays out. As updated estimates and ROI figures continue to roll in, the trend coming into focus is that spending is now growing faster than the revenue it’s meant to produce. The strain is showing up in free cash flow, where these companies are set to keep significantly less of what they earn. Amazon’s is projected to turn negative this year, Alphabet’s and Meta’s are collapsing toward a fraction of what they were, and Oracle has already crossed into negative territory. The chipmakers on the receiving end of all that spending are running the opposite way, with cash flow increasing at an exponential rate. As the spending climbs, investors will increasingly demand real results, or the stocks will pay the price for this widening gap between capex and revenue. Our read sits in the middle. The genuine need for more compute, power, and data centers is real. But when some of the largest companies in the world all pour staggering amounts into the same bet at the same time, then that is something to approach with caution.
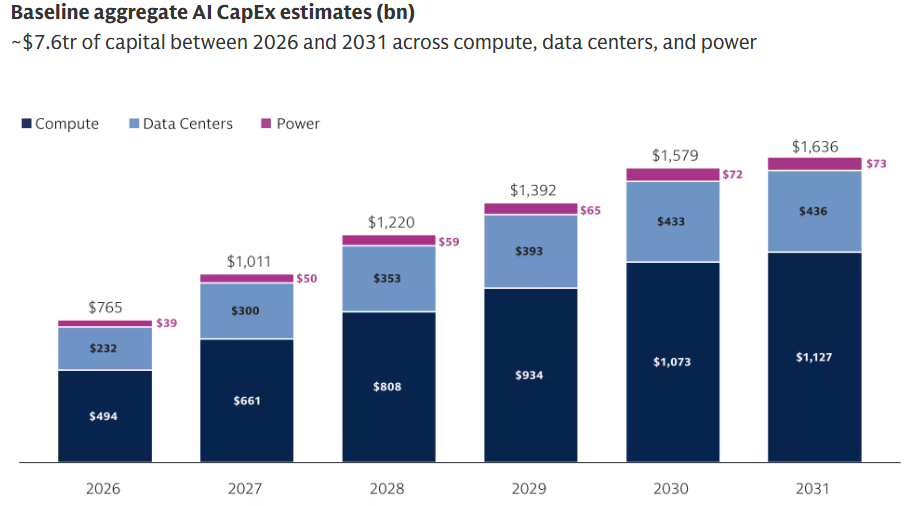
Source: Goldman Sachs Global Institute
References
- YCharts. Total Returns, April 1, 2026 – June 30, 2026.
- Bank of America Global Fund Manager Survey. (gold valuation chart)
- Barclays; Bloomberg. (S&P 500 drawdowns following Fed chair changes)
- The Compound Media; data via PitchBook. (SpaceX exit value chart)
- Goldman Sachs Global Investment Research. (baseline aggregate AI capex estimates, 2026–2031)
DISCLOSURE
Past performance is no assurance of future results. Trademark Financial Management, LLC (“Trademark”) is a registered investment adviser with its principal place of business in the State of Minnesota. Trademark and its representatives are in compliance with registration requirements imposed upon investment advisers by those states in which Trademark operates. Trademark may only transact business in those states in which it is registered or qualifies for an exemption or exclusion from registration. This newsletter is limited to the dissemination of general information pertaining to its investment advisory/management services. Any subsequent, direct communication by Trademark with a prospective client shall be conducted by a representative that is either registered or qualifies for an exemption or exclusion from registration in the state where the prospective client resides. A complete list of all recommendations will be provided if requested for the preceding period of not less than one year. It should not be assumed that recommendations made in the future will be profitable or will equal the performance of the securities in this list. Opinions expressed are those of Trademark Financial Management and are subject to change, not guaranteed and should not be considered recommendations to buy or sell any security. For information pertaining to the registration status of Trademark please contact Trademark at (952) 358-3395 or refer to the Investment Adviser Public Disclosure web site (www.adviserinfo.sec.gov). For additional information about Trademark, including fees and services, send for our disclosure statement as set forth on Form ADV from us using the contact information herein or by calling 952-358-3395. Please read the disclosure statement carefully before you invest or send money. Any reference to a chart, graph, formula, or software as a source of analysis used by Trademark Financial Management staff is one of many factors used to make investment decisions for your portfolio. No one graph, chart, formula, or software can in and of itself be used to determine which securities to buy or sell, when to buy or sell them, or assist any person in making decisions as to which securities to buy or sell or when to buy or sell them. Any chart, graph, formula, or software used is limited by the data entered and the created parameters. The data was obtained from third parties deemed by the adviser to be reliable. Nonetheless, the adviser has not verified the results and cannot be assured of their accuracy.