

Value Outpaces Growth as the Rotation Unwinds
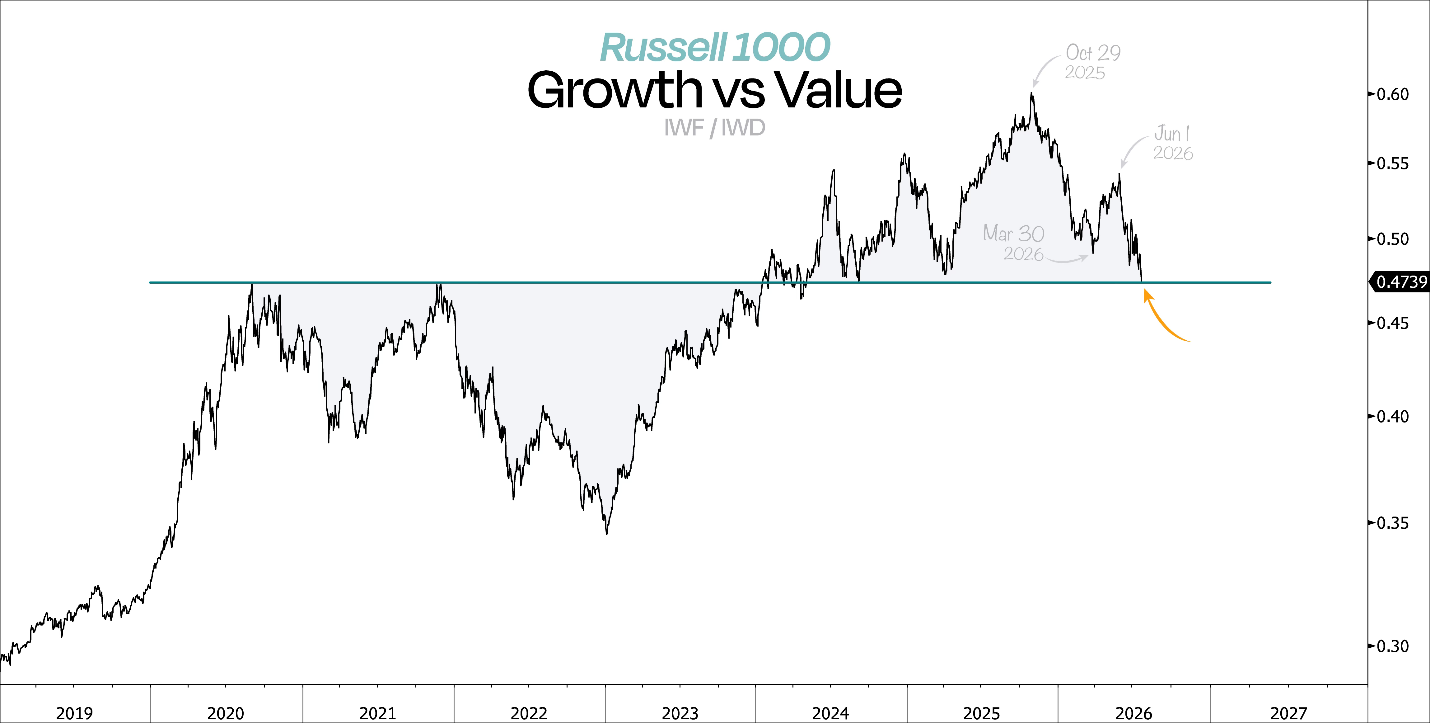
Source: Duality Research (Russell 1000 Growth vs. Value)
As of this writing, value is outperforming growth by roughly 20% year-to-date, with the Russell 1000 Growth ETF now in negative territory. We’re watching a broad-market rotation unwind in real time, and there are reasons to think it runs deeper than a typical style rotation. Investors are growing wary of the capex spending and circular-financing story underpinning the market’s leaders, and that fear is strong enough to push allocations toward more defensive value plays. It is easy for investors to want to chase gains, especially when the dispersion between the two is substantial, but that is how you get burned. The whole script can flip quickly, which is why we favor portfolios diversified across styles and strategies, with enough breadth to participate in gains without overconcentration in a single trend.
Emerging Market Concentration Is Its Own Semiconductor Bet
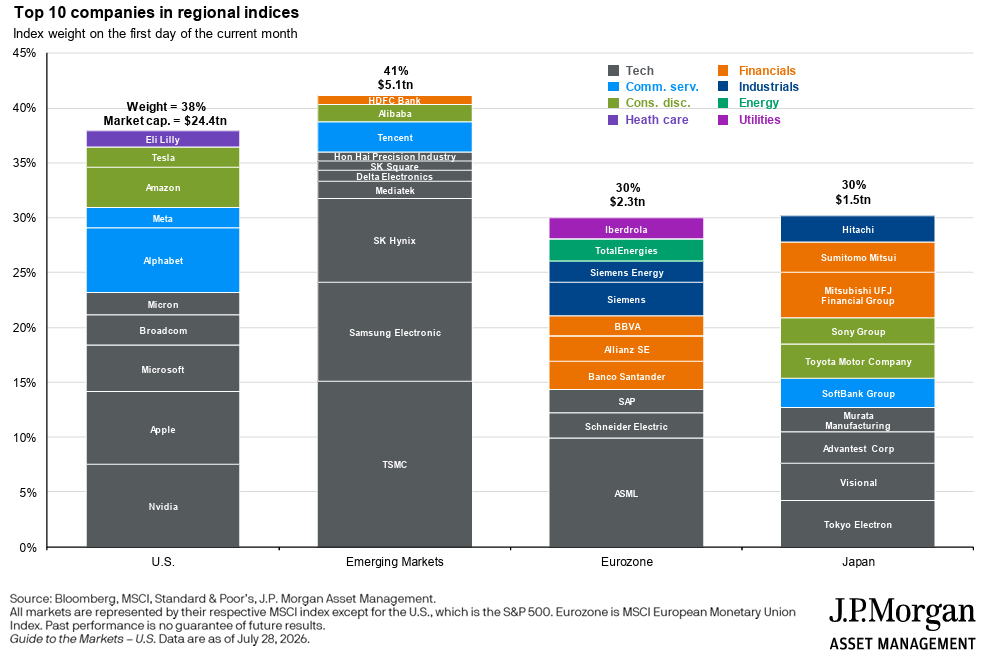
Source: Chart by JPMorgan Asset Management (Data by Bloomberg, MSCI, S&P)
We hear constantly about concentration in U.S. equities, but far less about emerging markets, where it looks to be more severe. TSMC, Samsung, and SK Hynix together make up over 30% of the index, and EM’s top 10 weight (41%) actually exceeds the U.S. (38%) on a fraction of the market cap. More concerning, that concentration is a single bet on the semiconductor complex, geographically pinned to Taiwan and South Korea, and it’s unraveling as the AI-memory trade sells off. The irony that a lot of investors do not realize is when reaching into EM to diversify away from concentrated U.S. tech, you are doubling down on the very same chip trade.
Earnings Season Turns on Capex Guidance
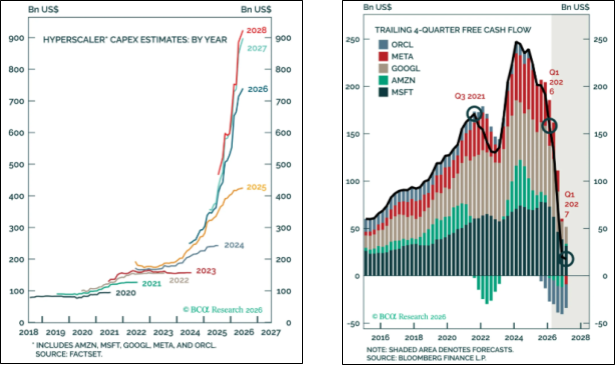
Source: BCA Research (Bull/Bear Debate)
We’re entering the thick of earnings season with the highest bar for expectations in years. Revenue and EPS growth are always the headline items when a company reports, but it’s the forward guidance commentary that really drives future price action. This season, the storyline is capital expenditures, specifically how much more the hyperscalers can pour into the AI buildout. The charts above show it: capex estimates are on pace to roughly double from 2025 to 2027, and these historically reliable free-cash-flow generators are projected to turn FCF-negative by 2027. Negative FCF isn’t automatically a red flag, but it becomes one if AI revenue growth doesn’t show up to justify the spending, and any crack in that growth story is what would turn heavy investment into a problem.
From the Magnificent Seven to the Hyperscalers
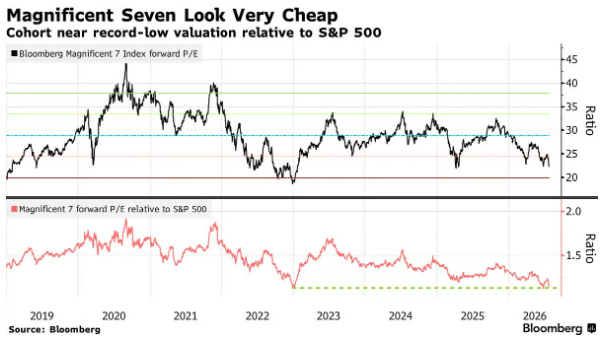
Source: Michael Msika (Bloomberg)
The “Magnificent Seven” framing feels increasingly dated. In practice, the conversation has narrowed to the “hyperscalers,” really just the handful of the seven actually driving the AI infrastructure spend, while names like Apple and Tesla have drifted out of the story. From a valuation standpoint, the group now trades at a forward P/E around 23, near the bottom of its seven-year range, and its premium relative to the S&P 500 has compressed as the group has underperformed. There’s been significant weakness across this group this year, Apple aside, and it’s worth watching whether these names find their footing from here on out.
CCC Spreads Widen While the Rest of Credit Stays Calm
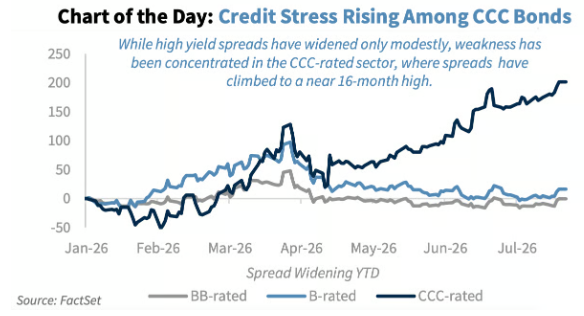
Source: Larry Adams of Raymond James (FactSet)
There hasn’t been much turbulence in the bond market this year. Spreads have remained tight, rates have held within healthy ranges, and yields remain attractive across a number of sectors. We’re currently seeing a modest widening in both investment-grade and high-yield spreads, roughly in line with normal seasonal patterns. The one area that stands out in the chart above is CCC-rated debt, which has widened roughly 200 bps year-to-date to nearly 815 bps, a 16-month high. Widening at the lowest tier of publicly traded debt is often an early-warning stress signal, and it’s notable that it’s happening while the rest of the market stays calm. These are also the companies most exposed to refinancing maturing low-cost debt at today’s far higher rates, squeezing margins toward a breaking point.
DISCLOSURE
Past performance is no assurance of future results. Trademark Financial Management, LLC (“Trademark”) is a registered investment adviser with its principal place of business in the State of Minnesota. Trademark and its representatives are in compliance with registration requirements imposed upon investment advisers by those states in which Trademark operates. Trademark may only transact business in those states in which it is registered or qualifies for an exemption or exclusion from registration. This newsletter is limited to the dissemination of general information pertaining to its investment advisory/management services. Any subsequent, direct communication by Trademark with a prospective client shall be conducted by a representative that is either registered or qualifies for an exemption or exclusion from registration in the state where the prospective client resides. A complete list of all recommendations will be provided if requested for the preceding period of not less than one year. It should not be assumed that recommendations made in the future will be profitable or will equal the performance of the securities in this list. Opinions expressed are those of Trademark Financial Management and are subject to change, not guaranteed and should not be considered recommendations to buy or sell any security. For information pertaining to the registration status of Trademark please contact Trademark at (952) 358-3395 or refer to the Investment Adviser Public Disclosure web site (www.adviserinfo.sec.gov). For additional information about Trademark, including fees and services, send for our disclosure statement as set forth on Form ADV from us using the contact information herein or by calling 952-358-3395. Please read the disclosure statement carefully before you invest or send money. Any reference to a chart, graph, formula, or software as a source of analysis used by Trademark Financial Management staff is one of many factors used to make investment decisions for your portfolio. No one graph, chart, formula, or software can in and of itself be used to determine which securities to buy or sell, when to buy or sell them, or assist any person in making decisions as to which securities to buy or sell or when to buy or sell them. Any chart, graph, formula, or software used is limited by the data entered and the created parameters. The data was obtained from third parties deemed by the adviser to be reliable. Nonetheless, the adviser has not verified the results and cannot be assured of their accuracy.