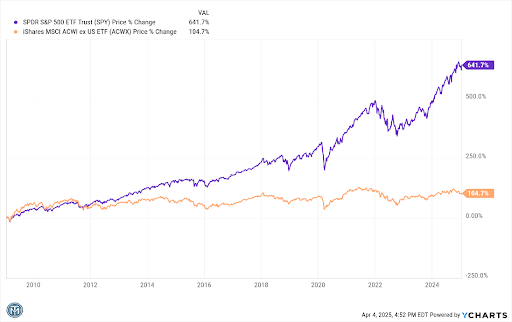
In negotiations, it can be valuable to create the impression that you are willing to take bigger risks than your adversary. Oftentimes, strategic “recklessness” can win concessions from an opposing party that is afraid to take the same risks. In order for this to work, the other side has to believe you are really crazy enough to do it, and your own side has to believe that you are only doing it for leverage and that you haven’t actually lost your mind. Call it “crazy like a fox” versus just plain crazy. Up until 3pm CDT on April 2nd, most of the market felt tariff negotiations were a bit of brinksmanship that would untimely lead to positive results. After the tariffs were announced, however, the perceptions changed. The tariffs were both larger than expected and seemingly without any regard to how the trade deficit with any given country came about or could be easily rectified. Thursday’s subsequent plunge in both stock prices AND the dollar were in sharp contrast to how the markets rallied back in November 2024 when tariffs were first threatened by the then President-elect. Then – crazy like a fox. Today – batcrap crazy.
Good negotiators need to know several things. One is the strength of their own position. Another is the ability for their opponent to back down. By openly challenging China to accept a very large tariff, he was seeking a very sought-after public “win”. Which China, playing the global public opinion game just as we are, could not afford to give him. They came right back and matched his 34% tariff. This morning, before the stock market opened, President Trump said he thought things were going very well. Effectively, he was saying he thought he would win in the end. The market thought “Oh no, this isn’t going to be over in a few days like we hoped.” A few hours later, investors’ desperate hopes for relief were dashed by Federal Reserve Chairman Powell, who said in essence, “I didn’t create this problem so it’s not mine to solve”.
Some explanation for why tariffs are such a frivolous issue is in order:
It is hard to see how the U.S. was hurt by running a trade deficit relative to our trading partners. They largely recycled the surplus into the purchase of U.S. bonds and stocks. Kind of a win-win. It wasn’t even a manufacturing jobs thing; those jobs were exported in the 1980s and 1990s. Blame Reagan, Bush I, and Clinton.
Journalist Andrew Eggar pointed out today that America doesn’t exactly want to wrestle the t-shirt market away from Honduras or Vietnam, because it would be difficult to get Americans to work at a t-shirt factory for a dollar an hour (which is what it would require for T-shirts to be sold for $5). Selling us cheap T-shirts does not harm America unless there were a large number of unemployed Americans who could afford to live on T-shirt wages. Unless we had a lot of semi-decent $200/month apartments available, nobody here could afford to take those jobs. Furthermore, America has largely become a services economy, not a manufactured goods economy. As such, we run a services surplus with almost everyone. President Trump did not factor this at all into his formula. The lack of credibility in terms of what countries were tariffed (Heard and McDonald Islands, only inhabited by penguins) contributed to the loss of confidence in the Administration and the results decline in both the dollar and stocks.
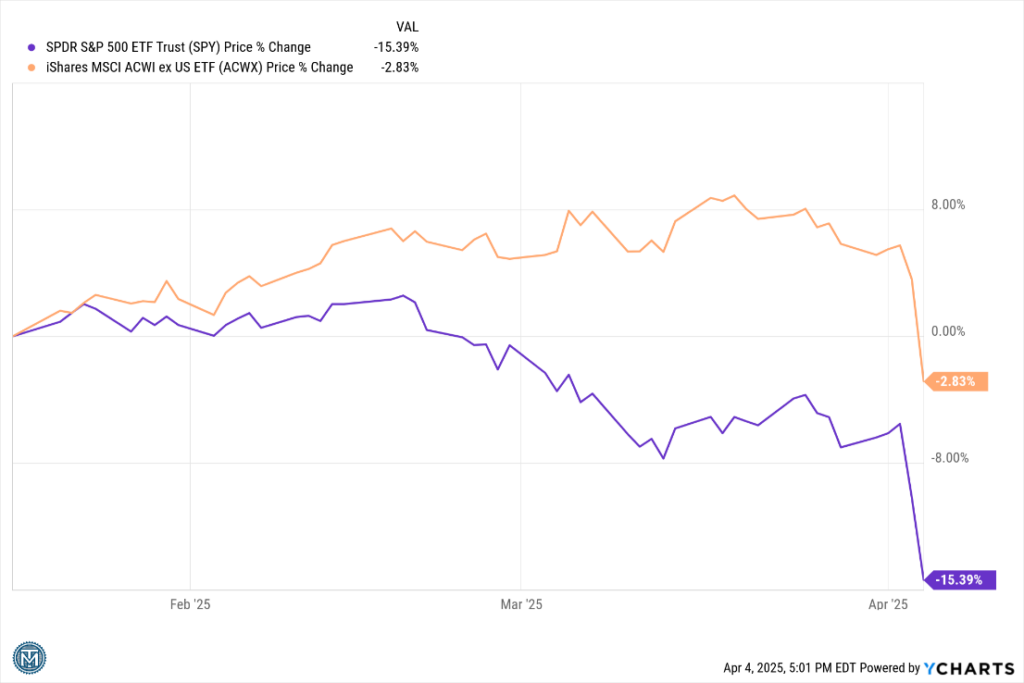
We are winning since Inauguration Day, but not in a good way.
In any event, the stock and bond markets are both pricing in reduced confidence that the tariff war will have a positive outcome, and they are both pricing in a much higher possibility of recession. Stocks that depend on economic growth (cyclicals) have been performing poorly, while stocks that are better positioned to ride out a recession (defensives) either gained or lost substantially less – that is, until today. At some point in a bear market, even the leaders get sold.
Safe treasury bonds have been gaining while riskier corporate bonds are slipping. We have been adding to our investment-grade bond positions because we think interest rates will decline as the economy continues to be harmed by the tariff war. High-quality bonds typically provide a bit of ballast against stock declines. We have been getting more defensive in stocks as well, but after the 9% plunge in stocks this week, it no longer makes sense to lighten up. 5100 on the S&P 500 (more or less today’s close) looks like fair value unless the tariff war drags on for months. If we can get a credible deal and no new attacks are forthcoming, we could bounce back up to 5500. I make no predictions.
DISCLOSURE
Past performance is no assurance of future results. Trademark Financial Management, LLC (“Trademark”) is a registered investment adviser with its principal place of business in the State of Minnesota. Trademark and its representatives are in compliance with registration requirements imposed upon investment advisers by those states in which Trademark operates. Trademark may only transact business in those states in which it is registered or qualifies for an exemption or exclusion from registration. This newsletter is limited to the dissemination of general information pertaining to its investment advisory/management services. Any subsequent, direct communication by Trademark with a prospective client shall be conducted by a representative that is either registered or qualifies for an exemption or exclusion from registration in the state where the prospective client resides. A complete list of all recommendations will be provided if requested for the preceding period of not less than one year. It should not be assumed that recommendations made in the future will be profitable or will equal the performance of the securities in this list. Opinions expressed are those of Trademark Financial Management and are subject to change, not guaranteed and should not be considered recommendations to buy or sell any security. For information pertaining to the registration status of Trademark please contact Trademark at (952) 358-3395 or refer to the Investment Adviser Public Disclosure web site (www.adviserinfo.sec.gov).
For additional information about Trademark, including fees and services, send for our disclosure statement as set forth on Form ADV from us using the contact information herein or by calling 952-358-3395. Please read the disclosure statement carefully before you invest or send money. Any reference to a chart, graph, formula, or software as a source of analysis used by Trademark Financial Management staff is one of many factors used to make investment decisions for your portfolio. No one graph, chart, formula, or software can in and of itself be used to determine which securities to buy or sell, when to buy or sell them, or assist any person in making decisions as to which securities to buy or sell or when to buy or sell them. Any chart, graph, formula, or software used is limited by the data entered and the created parameters. The data was obtained from third parties deemed by the adviser to be reliable. Nonetheless, the adviser has not verified the results and cannot be assured of their accuracy.
Market thoughts March 4, 2025 by Mark Carlton, CFA®
Dr. William J. Bernstein, Ph.D., M.D., a retired neurologist, and principal in the money management firm Efficient Frontier Advisors. He is also the author of several bestselling books on finance. In a 2021 MiB podcast, he made this observation:
“To the extent you succeed in finance, you succeed by suppressing the limbic system, your system 1, the very fast-moving emotional system. If you cannot suppress that, you are going to die poor.”1
Trademark Thoughts: Probably not, but you will almost certainly experience disappointing investment returns.
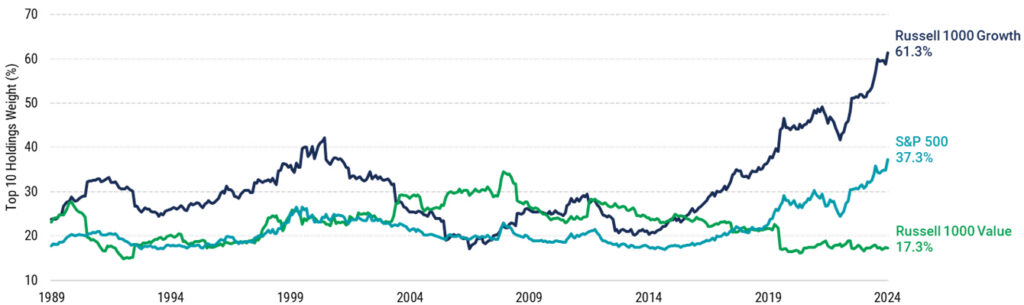
“Two years ago, the concentration of the U.S. stock market in its largest companies looked high compared to recent history. Today, some might say market concentration appears really high.”2
Trademark Thoughts: Huge outperformance from either growth or value hasn’t persisted historically. Gravity and mediocrity eventually catch up. Russell 1000 Growth is the worst performing of the three indices year to date.
From Bloomberg’s Money Stuff (Matt Levine):
“We talked last week about a paper by law professor Sue Guan, about how securities law does not really contemplate the modern reality of people buying stocks for non-financial reasons. I wrote: “If financial markets are increasingly a game, if what matters are not business fundamentals but memes and influence, then maybe nothing is securities fraud.”3
With memecoins — which are not even securities — this is even clearer. People want to buy memecoins because Dave Portnoy tweeted about buying them. He bought memecoins, tweeted about buying them, and sold them for a profit. There is nothing else going on here, so there is nothing for anyone to be deceived about; if there are no material facts, then nobody can be deceiving anyone about any material facts. “I don’t even know what I’m doing with my life,” was Portnoy’s takeaway from the experience, and mine too.”
Trademark Thoughts: A lot of what has gone on in financial markets over the last few years owes more to the area of psychology than to economics. If you buy something that has only “other people are buying it so the price is soaring” as an investment rationale, you have only yourself to blame if it fails.
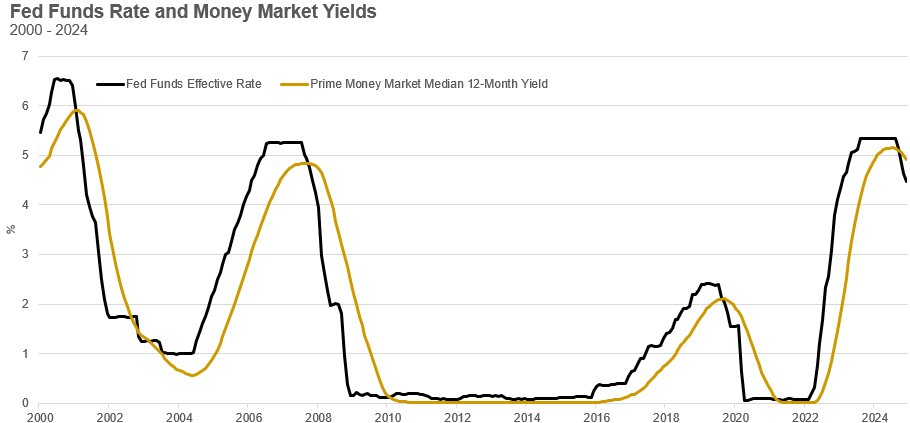
Interesting and a bit scary…
Historically, when the Fed funds rate has dipped below the money funds rate, stock prices have not done well. This is a warning sign.
On the current stock market sell-off: One can spot the conditions that suggest a higher level of risk, but one cannot predict when others will come to the same conclusion and act on it. Since the 2020 Covid-crash, stocks have done quite well as measured by the capitalization-weighted market indices, but the average stock has not done that well. These situations resolve themselves one of two ways – either small caps rally to catch up or large caps falter. Post-election there was a month-long surge in small cap stocks that rapidly reversed itself. Again, not a great sign. That said, however, betting against the largest 7 stocks has really hurt returns in recent years so one isn’t going to sell because the market might go down. One waits for confirmation. Confirmation isn’t a 5-8% plunge in stock prices – those happen frequently. Confirmation is a meaningful drop, a weak recovery, and a plunge to a level lower than the previous low. We aren’t there yet. More often than not, the plunge creates value and the market regains its “footing” and eventually a new high is recorded. Until the market decline is confirmed, we are looking for a rebound. But given the extremely unsettled macro environment – tariffs, layoffs, etc., we are going to have a short leash.
Past performance is no assurance of future results. Trademark Financial Management, LLC (“Trademark”) is a registered investment adviser with its principal place of business in the State of Minnesota. Trademark and its representatives are in compliance with registration requirements imposed upon investment advisers by those states in which Trademark operates. Trademark may only transact business in those states in which it is registered or qualifies for an exemption or exclusion from registration. This newsletter is limited to the dissemination of general information pertaining to its investment advisory/management services. Any subsequent, direct communication by Trademark with a prospective client shall be conducted by a representative that is either registered or qualifies for an exemption or exclusion from registration in the state where the prospective client resides. A complete list of all recommendations will be provided if requested for the preceding period of not less than one year. It should not be assumed that recommendations made in the future will be profitable or will equal the performance of the securities in this list. Opinions expressed are those of Trademark Financial Management and are subject to change, not guaranteed and should not be considered recommendations to buy or sell any security. For information pertaining to the registration status of Trademark please contact Trademark at (952) 358-3395 or refer to the Investment Adviser Public Disclosure web site (www.adviserinfo.sec.gov).
For additional information about Trademark, including fees and services, send for our disclosure statement as set forth on Form ADV from us using the contact information herein or by calling 952-358-3395. Please read the disclosure statement carefully before you invest or send money. Any reference to a chart, graph, formula, or software as a source of analysis used by Trademark Financial Management staff is one of many factors used to make investment decisions for your portfolio. No one graph, chart, formula, or software can in and of itself be used to determine which securities to buy or sell, when to buy or sell them, or assist any person in making decisions as to which securities to buy or sell or when to buy or sell them. Any chart, graph, formula, or software used is limited by the data entered and the created parameters. The data was obtained from third parties deemed by the adviser to be reliable. Nonetheless, the adviser has not verified the results and cannot be assured of their accuracy.
Summary
With dividends reinvested, the S&P 500 gained close to 25% in 2024, but only 2.4%1 of that came in the final three months. Stocks lost one percent in October (as is typical in the month leading into a presidential election). Stocks then rose 5.7% in November in what many market pundits referred to as the “Trump bump”, as investors looked favorably on the potential for less regulation and more merger activity. December saw the market give back almost half of that (-2.5%) as investors digested the policies of the president-elect and winced at their inflationary implications. Bonds had a fairly poor quarter (-3.1%) as interest rates rose sharply post-election. As a result, the full-year gain was cut to 1.3%. Small and mid-cap stocks are even more sensitive to interest rate movements than large caps; they rose 9% post-election, then gave almost all that back very quickly to finish the quarter with just a 0.3% advance. Interestingly enough, there was no “Santa Claus rally” during the final trading days of 2024.
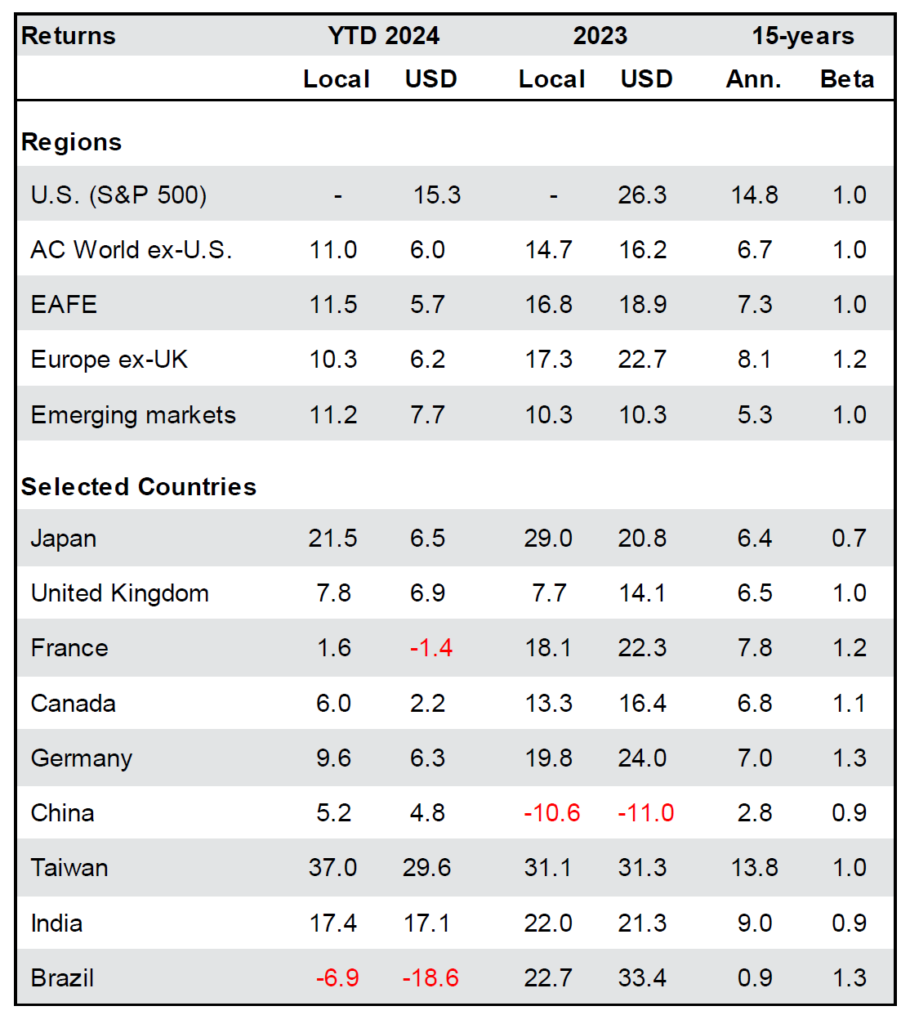
The biggest losers in November’s election may have been foreign stock investors. Largely because of threatened tariffs, foreign stocks lost -7.6% in U.S. dollar terms last quarter. Weakening prospects for economic growth in both Western Europe and China also played a part. Latin America, led by Brazil, was by far the poorest-performing region last quarter. Asia also struggled as Indian stocks took a breather after strong performance earlier in the year. Europe lost close to -8% during the quarter and the “winner”, Japan, still gave back five percent. Many argue as to whether there is value to be had in investing outside the U.S. It is true that foreign markets are less expensive in terms of valuation, but the growth rates and the profit margins of their companies tend to be quite a bit lower. With a company like Taiwan Semiconductor, however, you can get a high growth rate and a high profit margin with a price-to-earnings multiple lower than the average U.S. stock. Foreign stock investors just have to be more selective, which is why we very seldom index our foreign stock exposure, and why we underweight foreign stocks versus the global benchmark.
Bonds had a rough quarter. They rose over -3% to end the year up just 1.3%. A lot of bond analysis focuses on inflation as if that were the only important factor in where bonds prices go. Another factor and one that is taking on increasing significance these days is issuance versus demand. Simply put, if you try to sell more bonds than the bond market has the capacity or interest in buying, prices are going to go down – regardless of what inflation is doing. Inflation didn’t jump last quarter but because buyer interest in financing U.S. debt declined, the U.S. government had to offer higher yields to attract borrowers. Since corporate and mortgage debt is priced as a spread over U.S. government debt (because the government is less likely to default than a private payer), everybody’s borrowing costs rose. Only those bonds where the yield is attractive (higher) relative to government bonds (yet their default risk is still low) provide good returns in this environment.
Gold and cryptocurrency had a strong year. Gold rose largely because investors worldwide sought an alternative to questionable central bank and government policies. Cryptocurrencies surged as U.S. regulators approved ETFs that hold individual crypto tokens, such as bitcoin and Ethereum. They got a further boost after the election as President Trump promised to be a big crypto advocate.
Activity
Typically, markets are quiet into an election, and afterward, a narrative emerges in terms of which industries will be winners and which will be losers under the new regime. This time, it happened, but with a twist. It wasn’t about which industries would be losers but which countries. Tariff threats dominated the post-election market environment, so most market participants (even those overseas) figured that the best thing to do was invest in the U.S. to avoid that risk. The U.S., primarily because of its economic size and military strength, has the least to lose if global trade breaks down, though everyone would be a loser to some extent. Doing the math, the prudent play for asset allocators was to reduce international exposure, both developed and emerging, relative to US equity exposure. The second part of the tariff equation is higher interest rates, further stressing bond market didn’t have to do much. We were already defensive on the bond side and therefore had a lot less to lose from rising rates.
The other portfolio management consideration we had to address was determining the appropriate amount of large-cap technology exposure. Too little and you increased the amount you under-performed the index (which held over 35% in just eight companies at year-end); too much and you introduce too much risk to the portfolio since all investment manias ultimately end. In some portfolios, we added, and in some, we subtracted. More on this in the Commentary section.
Outlook
Writing this on Friday afternoon, January 17th, it is difficult to say where we are going to go from here. At this point, the U.S. economy is fairly strong and corporate earnings are expected to post low double-digit gains. Interest rates usually determine if the market will perform better than earnings would suggest or worse. So far this year, interest rates are up a little bit, so market gains have been modest.
All that said, we are soon to see the impact of tariffs on a scale we have never seen before (if the new President’s words are to be believed). We know that tariffs did not work in the late 1800s, and we know that they did not work AT ALL after the Smoot-Hawley Act was passed in 1930. However, it could be argued that the U.S. depended more on foreign trade in the late 19th and early 20th centuries then and was not the economic powerhouse that it is now. Since Trump’s election, markets have definitely made the calculation that since America is less dependent on its trading partners, it has less to lose from a trade war. As a result, investors have shifted assets out of countries and currencies that would be vulnerable to an economic attack from the United States. As U.S. investors, we have benefitted from this shift in the short run (more demand for dollar-based assets). It remains to be seen how long the benefit lasts. Whatever we do is bound to, at some point, produce a counter-response. It is for this reason that many strategists look for the first half of the year to be stronger than the second half.
Commentary – Risk Management Amid a Possible Speculative Bubble
2024 was another strong year for the U.S. stock market so it is probably a good time to discuss market returns and portfolio returns, as well as risk tolerance and fiduciary duty. Hopefully, this will help you to understand why stock index returns can differ a lot from portfolio returns in both directions (but typically, index returns are higher when the market is up).
First of all, I would like to point out how much investing has changed over the years. One hundred years ago, even sixty years ago, most investing was done through the trust department of banks. That is where people with significant wealth put their money because banks had a duty of care that stockbrokers didn’t have. If a bank lost your money through imprudent investments, it was legally liable to you. If you lost money with a stockbroker, on the other hand, you needed to prove fraud to have any recourse. Investing got a jolt in the 1960s as the stock market soared on the back of new technologies—integrated circuits, mainframe computers, instant photography, etc. Investors got frustrated by the safe but low-yielding options offered them by banks (bonds, preferred stocks, etc.), so as they did in the 1920s when cars and radio were the big new things, they began to speculate. Ultimately, this ended in tears as well. The first oil crisis in 1973-74 was a harsh reminder that even technology can fall prey to a global economic contraction.
The tension between investing and speculating has evolved over the last fifty years. Fiduciary investing became dominated by mutual funds and then indexed exchange-traded funds (ETFs), with speculation being done through individual stocks and privately traded vehicles. Speculators had their day trading phase in the late 1990s and then moved on to leveraged ETFs, leveraged single stock ETFs, SPACs, meme stocks, cryptocurrencies, and zero day-to-expiration option contracts (0-DTE) more recently. New innovations in speculation have historically always happened just before the top of a market cycle (because at the beginning of a cycle, investors are more cautious than greedy). It seems to me that we are probably near the top of the cycle now partially because2 of all of the new speculative vehicles that have been recently introduced, but admittedly, this is a gut feeling and not something I can know for certain.
As a Registered Investment Advisor (RIA), however, I have certain legal responsibilities, and as a Chartered Financial Analyst (CFA), I have fiduciary3 and ethical requirements. I am, therefore on the investment side of the equation, not the speculative. As such, I am more like a bank than a broker. There are risks I cannot take with a client’s money, even if the client wants me to. That doesn’t mean I’m always going to be correct. Putting all of someone’s money in Apple or Tesla ten years ago was not prudent from a fiduciary standpoint; it might have resulted in a complete loss. Obviously, we now know that it didn’t – those stocks turned out to have been far more lucrative than any diversified portfolio one could have owned. Things always look clearer in hindsight.
There is another component to what securities regulations and the CFA Standard require of me that you might not be aware of—abut you should be. As a fiduciary, I place your interests ahead of my own and my firm’s interests. Part of that is not lying to you making misrepresentations. The person on TV or radio selling you gold, real estate, or bitcoin is not similarly bound because those offerings are not securities. No, gold is NOT guaranteed to keep up with inflation. Sometimes it does, sometimes it doesn’t. Gold can and has trailed inflation for decades at a time. And, NO, you cannot buy top-quality real estate offering double-digit returns at below-market prices. The seller is not an idiot. If it is indeed top quality, high-returning real estate, and you offer a below-market price, somebody will outbid you. I say these things because I am frustrated with the current get-rich-quick environment—I see many things that I recognize from bad times past. One of them is technology mania.
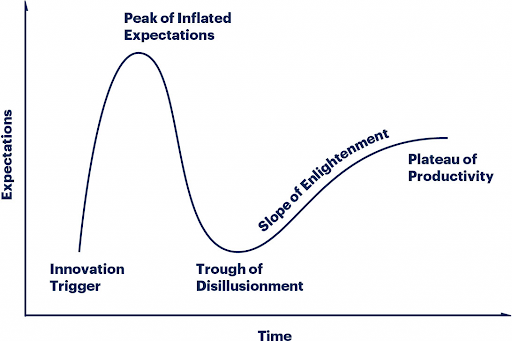
I don’t want to sound like a Luddite when I discuss artificial intelligence (AI). I believe AI will revolutionize many fields. It will change forever the way we do certain things. That said, similar things were said about the personal computer, the internet, fiber optics, and cloud computing, and ultimately all came true. Yet these permanent changes in the way we live and work did not prevent investors from experiencing substantial drawdowns. Each of these areas went through what is known as the Gartner Hype Cycle.
Stocks soared on the promise of the new technology (the sky was almost literally the limit), then fell back sharply as profits were slower in coming even as usage of the new technology ramped up. Eventually, the new technology generated profits that could be predicted and valued, and gains in these stocks were more linear than exponential.
When I have written in the past about the concentration of investment returns and market capitalization in a surprisingly small number of companies, this is what I’m talking about. The idea that it is not financially prudent to concentrate so much of one’s investment portfolio in one industry (technology) or in one country (the U.S., obviously). An institutional investor like the Minnesota Public Employees Retirement Plan or an endowment like the University of Washington’s UWINCO would never be invested that way. Your money shouldn’t either.
So, getting back to the question of what one should expect in a year like 2024, here is how I see it: Large U.S. stocks returned 25%. The biggest 7 stocks gained 64%, but the other 493 companies in the S&P 500 gained around 18%. Stocks smaller than that averaged 11.5%. Since large caps are 80%+ of the market, weighting large stocks higher relative to small gives one about a 22% expected return on an all-U.S. portfolio (22.5% with a modest top 7 overweight). Foreign stocks gained a dismal 5.5%, and that was only achieved by virtue of a 10.6% emerging markets return. In contrast, developed markets ex-U.S. gained 3.2%. It was difficult to achieve even that 5.5% because it required just under 9% in China (one of the best-performing foreign markets last year).4 Given that about two-thirds of global market capitalization is in the U.S., a global stock portfolio should have returned about 17% last year.5 It would not have been a stretch to have foreseen that U.S. stocks could probably outperform, so a three-quarters U.S.-to-foreign ratio seems more appropriate. That puts global stock returns at 18.2%.
The rest of a portfolio is made up of bonds and alternatives. The Bloomberg Aggregate Bond Index gained 1.3% last year, but no good bond manager failed to beat that easily6 because short-term rates were closer to 5%. Let’s agree on 3% for U.S. bonds as a reasonable return. International bonds gained about 4.5%; since 5/7 of the global liquid debt market is the U.S., we wind up with a net global bond return of 3.5%. Alternatives like gold would have added to returns last year, but other commodities (chiefly oil) and real estate would have negated much of gold’s impressive surge.
In the end, a naïve (indexed) 50:50 stock and bond portfolio would have returned about 9.6% before fees (17%+2.2% divided by two), whereas an intelligently-weighted portfolio would have returned closer to 11% (18.2%+3.5%). Obviously, actual portfolios will almost certainly have a different stock-bond ratio than 50:50. This exercise should provide a template to figure out expected performance. In some years, active individual mutual funds and ETFs give us a bigger boost because we are able to lean into established trends. In other years, however, markets shift away from factors that have been previously very successful, and that shift takes a while to reveal itself as permanent.7
I realize in that in this commentary, I’ve thrown a lot at you. There was just so much to say. I wanted to explain why I feel we are in another era that is fraught with danger for investors. I wanted you to know how much thought goes into portfolio construction. I feel it is very important for you to be able to distinguish between investment and speculation, and though we on the investment side don’t always get it right we always have your interests first. Lastly, I wanted you to know how we assess 2024, a rare year in which one area the market was exceptionally strong but so much more of it provided much more modest returns.
[1] Charles Schwab “It was a Very Good Year” commentary and table, Jan 6, 2025. ↩︎
[2] And also because of the current high historical valuation of the market. ↩︎
[3] Fidiciary is defined as someone who is required to act in the best interest of someone else. The CFA Standard requires me to act with reasonable care and exercise prudent judgment. ↩︎
[4] Trump might have aimed at China post-election, but the bullets hit Europe. ↩︎
[5] Vanguard’s flagship Total World Stock ETF gained 16.5% in 2024 ↩︎
[6] We are in an era where the top stocks are extremely difficult to beat but the top bonds (by issuance) are very easy to outperform. ↩︎
[7] Last year “wide moat” investment strategies broke down. Wide moats are businesses with high barriers to entry that make them hard to compete with. Alphabet (Google) has a wide moat (search), but so does Boeing. There is no guarantee that these companies will be well managed. ↩︎
DISCLOSURE
Past performance is no assurance of future results. Trademark Financial Management, LLC (“Trademark”) is a registered investment adviser with its principal place of business in the State of Minnesota. Trademark and its representatives are in compliance with registration requirements imposed upon investment advisers by those states in which Trademark operates. Trademark may only transact business in those states in which it is registered or qualifies for an exemption or exclusion from registration. This newsletter is limited to the dissemination of general information pertaining to its investment advisory/management services. Any subsequent, direct communication by Trademark with a prospective client shall be conducted by a representative that is either registered or qualifies for an exemption or exclusion from registration in the state where the prospective client resides. A complete list of all recommendations will be provided if requested for the preceding period of not less than one year. It should not be assumed that recommendations made in the future will be profitable or will equal the performance of the securities in this list. Opinions expressed are those of Trademark Financial Management and are subject to change, not guaranteed and should not be considered recommendations to buy or sell any security. For information pertaining to the registration status of Trademark please contact Trademark at (952) 358-3395 or refer to the Investment Adviser Public Disclosure web site (www.adviserinfo.sec.gov).
For additional information about Trademark, including fees and services, send for our disclosure statement as set forth on Form ADV from us using the contact information herein or by calling 952-358-3395. Please read the disclosure statement carefully before you invest or send money. Any reference to a chart, graph, formula, or software as a source of analysis used by Trademark Financial Management staff is one of many factors used to make investment decisions for your portfolio. No one graph, chart, formula, or software can in and of itself be used to determine which securities to buy or sell, when to buy or sell them, or assist any person in making decisions as to which securities to buy or sell or when to buy or sell them. Any chart, graph, formula, or software used is limited by the data entered and the created parameters. The data was obtained from third parties deemed by the adviser to be reliable. Nonetheless, the adviser has not verified the results and cannot be assured of their accuracy.
Trademark Blog Post – December 11, 2024:
The U.S. stock market surged after the November election. Investors remembered that in the first year of Donald Trump’s first term (2017), in which taxes were cut, regulations were curtailed, and government spending took off. This combination made for a very good year for stocks, so the market is betting on the same combination in 2025. It may happen, but it’s important to note that the economy was growing at a much slower rate in late 2016 and inflation wasn’t on anybody’s mind back then. A tax cut not offset by fiscal restraint (spending cuts) would probably unnerve the bond market, leading to higher interest rates. The selection of Scott Bessent for Treasury Secretary initially helped calm the bond market due to his long career on Wall Street.
Much of the fuel for the gain in the U.S. stock market has come from investors shifting out of foreign stocks and currencies. It appears investors (both here and abroad) feel that at least initially the proposed tariffs will take a larger bite out of foreign stocks and currencies. The big question for 2025 and beyond is – how big will the response be?
Another thing that seems to be driving markets recently is the explosion in digital assets. While the U.S. stock market is 6.6% ahead of its close the day before election, bitcoin is 50% higher. Some tokens have done even better. The proximate cause for this is that the incoming Trump Administration promises to be much more friendly to “cryptos” than the Biden Administration’s regulators were. Gains of 50% or more in a very short time period in several of the digital tokens drove investors into a bit of a speculative frenzy, because they believe they can really get rich quick. This bled over into stocks; the artificial intelligence and quantum computing sub-sectors have soared almost as much as digital assets. Markets that trade on hope and greed are exciting, but they tend not to end well. If money management were nothing more than performance chasing, we would know where to invest, but we could not guarantee we’d have a chair, so to speak, when the “music” stopped playing. This is an exciting but dangerous time to be an investor.
Fraudsters don’t take holidays:
With the holiday season upon us fraudsters are ready to take full advantage of any opportunity to gain access to personal information. Both Trademark Financial Management and Charles Schwab are committed to protecting your private information. Schwab released a list of common fraud methods to help you, and your friends, family, and colleagues shop safely this holiday season.1
First, be sure you’re familiar with the most common fraud methods:
Phishing /Email Account Compromise: Scammers send deceptive emails, texts, or messages designed to trick recipients into clicking malicious links or revealing sensitive information, often by impersonating reputable organizations. Additionally, thieves may attempt to gain access to e-mail accounts and use them to intercept financial communications or initiate fraudulent requests. Remember to always verbally verify all money movement instructions received via e-mail–including 1st party money movement requests.
Social engineering: fraudsters may pose as trusted retailers, charities, or even friends, pressuring victims into providing sensitive information or making payments. Stay skeptical of unsolicited requests and verify independently before acting.
Financial account takeover:Fraudsters use stolen credentials, malware, or breached information, to gain unauthorized access to accounts, often using the holiday season’s surge in online shopping to make unauthorized credit card purchases or transfers. Monitor accounts closely and report suspicious activity immediately.
Questions to ask when shopping online:
Are you on a secure network? It’s easy to hit the “Buy” button from anywhere when you are on your phone or laptop. But if you’re shopping on a public network, your personal information—and your credit card number—might be intercepted by scammers. Wait to purchase until you’re on a secure network.
Is this retailer or website genuine? Fraudsters set up convincing fake online stores offering discounts that are too good to be true. Always verify the legitimacy of websites before entering personal or payment information.
Is this shipping update legit? Be wary of unexpected emails or texts claiming to be from shipping companies asking you to click on links to confirm delivery details. These links often lead to malware or phishing attempts.
How do I know this gift card is valid? Gift cards are convenient, but they can open the door to scams. To ensure your gift card is protected, avoid the rack, and ask for one directly from the person behind the counter. And remember—no legitimate retailer or charity will demand gift cards for payment.
Can I trust this deal I saw on social media? Too-good-to-be-true deals on social media sites are often illegitimate. Carefully read reviews, look for security credentials on websites, and research unfamiliar retailers before you take advantage of a discount. A secure site will display https:// in the URL and a padlock icon in the address bar.
Can I pay by credit card? These cards offer the best protection against fraudulent transactions.
What does the Better Business Bureau have to say? Their scam BBB Scam Tracker can help you identify crimes and issues that are occurring in your area.
Both successful and prevented fraud attempts should be reported immediately.
On a personal note:
On Wednesday morning my mother, Donna Carlton, died at the age of 83. She had a 33-year career in financial services, starting out in 1977 when there were very few women in the industry and almost none in any kind of leadership role. She was successful because she worked very hard and she really cared about her clients. She gave me my start in the industry as an office assistant and early computer software user, and in doing so I found an aptitude for the analytical side of the business. Her father, my grandfather, had owned a dry goods store on the Iron Range in its heyday. He always told her that if you took care of your customers, they would take care of you. That is how she ran her business until she retired in 2010, and what I learned from her. I will always be in her debt.
Past performance is no assurance of future results. Trademark Financial Management, LLC (“Trademark”) is a registered investment adviser with its principal place of business in the State of Minnesota. Trademark and its representatives are in compliance with registration requirements imposed upon investment advisers by those states in which Trademark operates. Trademark may only transact business in those states in which it is registered or qualifies for an exemption or exclusion from registration. This newsletter is limited to the dissemination of general information pertaining to its investment advisory/management services. Any subsequent, direct communication by Trademark with a prospective client shall be conducted by a representative that is either registered or qualifies for an exemption or exclusion from registration in the state where the prospective client resides. A complete list of all recommendations will be provided if requested for the preceding period of not less than one year. It should not be assumed that recommendations made in the future will be profitable or will equal the performance of the securities in this list. Opinions expressed are those of Trademark Financial Management and are subject to change, not guaranteed and should not be considered recommendations to buy or sell any security. For information pertaining to the registration status of Trademark please contact Trademark at (952) 358-3395 or refer to the Investment Adviser Public Disclosure web site (www.adviserinfo.sec.gov).
For additional information about Trademark, including fees and services, send for our disclosure statement as set forth on Form ADV from us using the contact information herein or by calling 952-358-3395. Please read the disclosure statement carefully before you invest or send money. Any reference to a chart, graph, formula, or software as a source of analysis used by Trademark Financial Management staff is one of many factors used to make investment decisions for your portfolio. No one graph, chart, formula, or software can in and of itself be used to determine which securities to buy or sell, when to buy or sell them, or assist any person in making decisions as to which securities to buy or sell or when to buy or sell them. Any chart, graph, formula, or software used is limited by the data entered and the created parameters. The data was obtained from third parties deemed by the adviser to be reliable. Nonetheless, the adviser has not verified the results and cannot be assured of their accuracy.
Summary
The S&P 500 gained 4.3% last quarter, and 15.3% in the first half of the year.1 That is the good news. The bad news was that this return was driven by a handful of stocks; the market as a whole did not make nearly as much. The Dow Jones Industrial Average declined -1.7% last quarter, and the Russell 2000 Small Cap Index gave back -3.3%. The U.S. stock market has been trading on the premise that the economy is slowly moving toward recession and in that environment only large companies with strong balance sheets and large cash hoards can prosper. There may only be 15-20 companies that qualify, but these companies comprise over 50% of the market capitalization of the S&P 500 index. Oddly enough, we have many days where the top handful of firms move in the opposite direction as the rest of the stock market. More on that later.
Foreign market performance reflects the strength of the U.S. dollar. In local currency terms, foreign markets are up 11% but to U.S. dollar investors (like ourselves) foreign markets are up only 6%. The poorer performance of international stocks in U.S. dollar terms is why we hedge about 30% of our international stock exposure. The dollar has been particularly strong against the Japanese yen, where hedging has improved returns by 15%. In the case of a stronger currency, such as the Indian rupee, the performance difference is only 0.3%. Taiwan has been the strongest foreign market due to one superstock (Taiwan Semiconductor Manufacturing Company). Brazil has been the worst of the large foreign markets.
Bonds were interesting last quarter. Ostensibly, the bond market returned nothing (0.0%) in the second quarter, leaving year-to-date performance of the Bloomberg US Aggregate benchmark at -0.7%. However, unlike with stocks and the S&P 500, it is comparatively easier to find bonds not in the benchmark that outperform. We use a higher portion of short-term bonds in our portfolios and with the Federal funds rate at 5.37%, these positions returned about 1.3% over the quarter. Our longer-term bond funds tend to have a higher exposure to out-of-benchmark bonds, non-rated bonds, and credit, and these positions earned over 0.5% for the quarter on average. A smaller percentage of bond portfolios were invested in opportunistic public credit or private credit, which generated nearly 2% over the quarter, on average.
Gold returned 3.5% in the second quarter. Hopes for interest rate cuts later in the year and concerns over the rising debt levels in the United States offset the headwind of a strong dollar. Other commodities barely budged. Oil prices continued to be restrained despite the continuing conflict and risks in the Middle East.
Activity
Most of the activity in the second quarter involved trimming or moving money out of what wasn’t working (small and mid-size U.S. stock funds, alternatives in the real estate or global infrastructure areas, and ETFs that focus on out-of-favor niches of the market). I believe the valuations of the largest companies in the S&P 500 are very rich by historical standards. However, I also know we haven’t had such an enduring period of technological domination of the economy before. I want to protect investors from the risks of extreme over-exposure to a sector, but I also need to provide competitive investment performance. The bottom line is that despite my concerns, I have had to increase the weightings of these stocks in portfolios. A strategy of “buy low, sell high” sounds good, but it has not worked well over the last ten years, and it hasn’t worked at all since March 2023. Again, more on that later.
Outlook
So much depends on which comes first: recession or interest rate cuts. If recession comes first, small stock prices are going to stay depressed, and large stock prices are going to converge with them on the downside. If interest rate cuts come first, investors will likely conclude that recession will be largely or completely avoided, and small-cap and value stocks will probably converge with large-cap stocks on the upside. If the worst of the inflation is behind us and the economic future is better, investors don’t need to limit themselves to 15 or 20 names; the vast majority of stocks will do better. The “safety premium” in those large technology names will be reduced because it isn’t needed. The dramatic, colossal outperformance by large tech stocks required an environment of “not too hot, not too cold”. That dovetailed nicely with what the Federal Reserve was trying to achieve (an inflation-reducing slowdown without an actual recession). This environment has already lasted a very long term and produced price distortions of epic proportions. One way or the other, I believe that is near its end.
An aside – yes, this is the Outlook section, but I have no desire to comment on the upcoming election. As the first few weeks of the quarter have shown, the outlook in one week is very different than the outlook in the following week.
Commentary – Buy Low, Sell High Versus Buy High, Sell Higher
It has long been the popular cliché – How do you make money on Wall Street? Buy low and sell high! My training as a financial analyst in the 1990s was all about trying to find undervalued securities and holding them until their value was realized. You didn’t chase the market – everybody knew that didn’t work. Mountains of studies were undertaken going back to the late 1920s and all of them concluded that finding a good company at a fair price and patiently holding that stock and collecting the dividend was the key to wealth accumulation. If that wasn’t enough, you had the Oracle of Omaha, Warren Buffett, admonishing the speculators and preaching discipline and patience. After all, you didn’t want to be like those speculators of the 1920s who wound up jumping out of windows when the market crashed or those who were wiped out when the Nifty Fifty craze ran smack into the Arab Oil Embargo in 1973.
As is often the problem with things we all know to be true, market certainties can cease being true. Buy high, sell higher is the competing strategy with “buy low, sell high.” It argues that the best way to make money is to buy stocks that are already doing well, because those companies are more likely to continue to do well. It offers the psychological advantage of buying winners that the other strategy does not. Value advocates had claimed, with apparently good reason, that the market doesn’t reward you for doing what is easy, or else every investor would be rich.
Starting about 10-15 years ago, things began to change. “Buy high, sell higher” began performing a lot better than a value-oriented strategy. Some of us market veterans believed that this outperformance was a cyclical anomaly and that in a few years the stock market would go back to behaving as it always had. Sometimes markets get a little frothy, but they always self-correct. We thought this would happen in late 2018 as higher rates caused a bit of a hiccup, but in 2019 the new paradigm re-asserted itself. We thought it again in 2020 after the sharp Covid plunge and again in 2022 with the inflation surge, but each time the most loved, most expensive stocks lapped the rest of the field. So much so that studies from 1946 to the present show that “buy high, sell higher” is a superior strategy. It seems that omitting the Depression Era is significant because surviving stocks had a very large bounce after the worst of the Depression passed which skewed the numbers. In any event, outside of a smashing of the stock market, momentum contributes positively to investment returns over the long term versus value. The question is, what do you do with this information now?
The easy answer would seem to be: “buy high and sell higher.” The data shows that the strategy works and it is certainly ingrained among stock investors today. When I started in the industry 37 years ago there was nothing that excited investors more than a stock that was trading for less than book value.2 It was like finding money on the street. Today nobody looks at book value. It might take years to realize that hidden value, whereas a hot stock can make you good money in an hour or two. But even if you accept the premise that “buy high, sell higher” is a superior strategy, you have to believe that 1) there is no new Depression coming; and 2) that the current period isn’t a distorting anomaly in the opposite direction of what the Depression Era was.
I recently attended a presentation on the current state of buy low, sell high (value) investing. The subtext was: “why isn’t it working anymore?” Of course, that was the wrong question to ask. The right question is: “why is buy high, sell higher (growth) investing doing so well?” The reason is that growth previously consisted of companies and industries for which their advantage was transitory. Falling commodity prices helped consumer and food stocks in the 1980s, but eventually, commodity prices leveled out. The pharmaceutical companies were the growth winners of the early 1990s, but over time expiring patents and regulatory scrutiny over price gouging caught up with them. We all know about the late 1990s dot.com boom and bust and the early 2000s banking and real estate rise and hard fall. The market was dynamic, and no company or industry stayed on top for more than a few years. If you bought high, chances are you bought close to the top and things didn’t work out all that well for you. Then came the platform technology companies.
By platform, I mean that the company was able to create its own ecosystem. You bought the product (iPhone, Tesla, etc.), and you were locked into paying for its services and upgrades. You used the service (Amazon, Google, Facebook) and their related applications made it difficult to go elsewhere. Nobody could effectively compete. There are streaming alternatives to Netflix and semiconductor chip alternatives to Nvidia, but right now they are not nearly as good. Platform companies command relative valuation levels today that are larger than the best companies of the last century could dream of. Maybe this is justified. But only if the world stops changing.
Some Charts of Interest
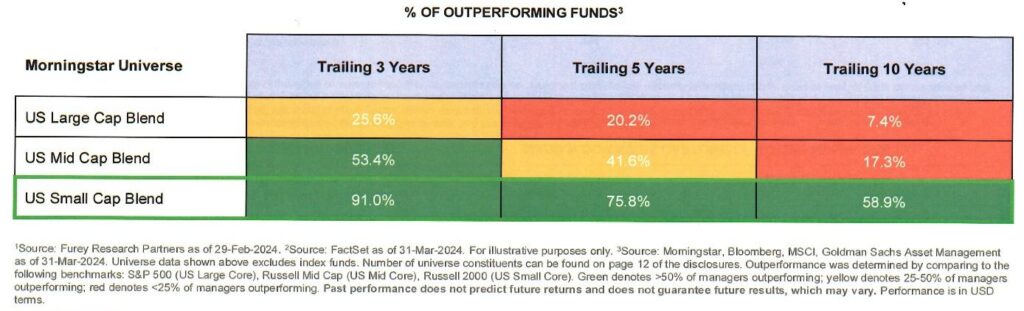
This is a chart of active management versus passive (index) management. What it shows is that it has been very difficult for active managers to beat the over the past ten years because the biggest stocks have done so much better than large stocks as a whole. When you go to mid-size and smaller stocks, you don’t find dominance by a few stocks and as a result managers beat indexes a greater percentage of the time.
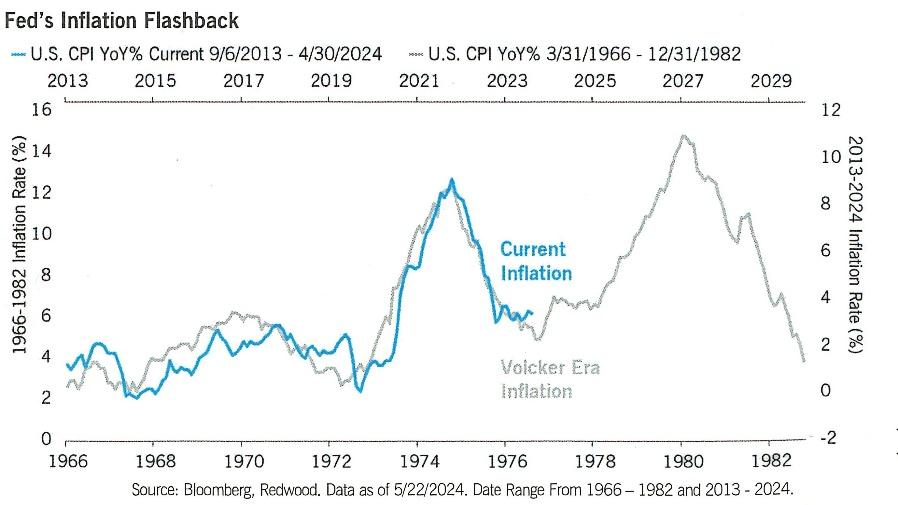
There are some concern that inflationary cycles have two waves. The Federal Reserve has been reluctant to cut rates as the Fed did in the 1970s lest they get a similar result.Investors seem to be “all-in” for stocks right now. Current levels of loving stocks and hating bonds are reminiscent of past cycles, each of which preceded a decade or more of stock weakness.Following the previous chart, once a long-term uptrend ends (and I’m not saying we are at that point yet) investors have to be very creative in order to maintain purchasing power.
[1] JPMorgan 3rd Quarter 2024 Guide to the Markets page 15 ↩︎
[2] “Book value” meaning the current market value of a company’s assets minus it’s liabilities. ↩︎
DISCLOSURE
Past performance is no assurance of future results. Trademark Financial Management, LLC (“Trademark”) is a registered investment adviser with its principal place of business in the State of Minnesota. Trademark and its representatives are in compliance with registration requirements imposed upon investment advisers by those states in which Trademark operates. Trademark may only transact business in those states in which it is registered or qualifies for an exemption or exclusion from registration. This newsletter is limited to the dissemination of general information pertaining to its investment advisory/management services. Any subsequent, direct communication by Trademark with a prospective client shall be conducted by a representative that is either registered or qualifies for an exemption or exclusion from registration in the state where the prospective client resides. A complete list of all recommendations will be provided if requested for the preceding period of not less than one year. It should not be assumed that recommendations made in the future will be profitable or will equal the performance of the securities in this list. Opinions expressed are those of Trademark Financial Management and are subject to change, not guaranteed and should not be considered recommendations to buy or sell any security. For information pertaining to the registration status of Trademark please contact Trademark at (952) 358-3395 or refer to the Investment Adviser Public Disclosure web site (www.adviserinfo.sec.gov).
For additional information about Trademark, including fees and services, send for our disclosure statement as set forth on Form ADV from us using the contact information herein or by calling 952-358-3395. Please read the disclosure statement carefully before you invest or send money. Any reference to a chart, graph, formula, or software as a source of analysis used by Trademark Financial Management staff is one of many factors used to make investment decisions for your portfolio. No one graph, chart, formula, or software can in and of itself be used to determine which securities to buy or sell, when to buy or sell them, or assist any person in making decisions as to which securities to buy or sell or when to buy or sell them. Any chart, graph, formula, or software used is limited by the data entered and the created parameters. The data was obtained from third parties deemed by the adviser to be reliable. Nonetheless, the adviser has not verified the results and cannot be assured of their accuracy.
It seems to me that the world is now in a new interest rate paradigm. The 10-year Treasury Note’s yield struck 5% several days ago, and while it is probably oversold at present (when yields go up when bond prices go down) nonetheless, the yield is back in the range it occupied for most of the 1990s and 2000s. This has prompted investors to “de-rate” most of the stock market or in other words, to lower the range of the multiple of earnings that they are willing to pay.1 Remember, financial wonks use interest rates as a key input when they project the present value of future expected company earnings. When interest rates rise, the present value of those future earning decreases.
During the post-GFC world in which interest rates were suppressed, investors re-rated stocks because their cost of capital was going to be lower than normal for the foreseeable future. Additionally, the lower interest rate environment supported higher valuations as the present value of future expected company earnings increased. No industry was a greater beneficiary of this than technology, where future growth is significantly more valuable to most firms than current earnings and assets. That said, all companies benefitted, to some extent.
P/E multiples expanded from the 15-17 times range of the afore-mentioned era to 19 times earnings, and even higher at times in the late 2010s ending in 2021. That year, inflation broke out. The Federal Reserve was late to react because it was slow to grasp that the forces that had reinforced the dominant deflation narrative had been broken by the massive government response to the Covid Crisis and by geo-political changes. At that time, it became evident that China wasn’t going to be exporting deflation, and there would no longer be a “peace dividend”.
The U.S. economy as a whole did not threaten collapse when the Fed pushed rates above 3%, as it did in late 2018. To the surprise of most, 4% didn’t bring the economy down, nor did 4.5%, 5%, or even today’s 5.5% (so it would seem). Businesses that were very profitable during the low interest rate period are far less profitable, or even not viable, in today’s new rate environment. Their stock prices are beginning to reflect that new reality. Industries like telecommunications and banks were not able to tolerate 4% rates. Others (real estate, utilities, consumer staples) broke between 4% and 5% because they adapted their (slower-growing) business models toward greater leverage when rates were low. Even higher growth industries like biotechnology eventually broke, as 5% rates meant that losses could not be financed indefinitely.
The interesting thing is that if one compares non-technology stock performance in the U.S. to non-technology stock performance elsewhere in the world, it is very similar. The U.S. won the performance sweepstakes over the past 13 years because its technology sector is far broader and deeper than anyone else’s. That said, even technology doesn’t develop as fast when financing is more expensive and harder to obtain. We believe the de-rating process is largely complete for value stocks, small cap stocks, and foreign stocks as their multiples now appear reasonable to dirt cheap (international small caps). That said, if a tech stock de-rating drags down markets, those cheap sub-sectors may get even cheaper.
The industry that has suffered the greatest de-rating has been health care, which in past cycles has benefitted from being somewhat recession resistant. More than that, health care has been a secular play on aging. Within the health care sector, the medical product & services subgroup has been destroyed. There is a view that GLP-1 drugs like Ozempic are going to make the population less obese and as a result we will have much less need for things like artificial knees and heart valve replacements. Evidently, we are all going to age gracefully now. I would very much like to take the “under” on that. At some point, this is going to be a great area to invest in.
I believe that it is going to be very difficult to get inflation under 3% without putting the economy into a contraction that will be extremely politically difficult. Fiscal policy has remained expansionary enough to offset a lot of the monetary tightness the Fed has tried to implement. This is a big reason why the economy has avoided recession, and yet most people believe the economy is in fair to poor condition today. It follows that if inflation doesn’t really get below 3%, long bonds won’t get below 4%.2 Even 4% assumes well-contained inflation and prudent fiscal policy; I think it is reasonable to assume we aren’t going to see the latter anytime soon. This puts the Treasury Note long-term yield into the range of 4.25%-5.00% with a 25 basis point “overshooting” allowance on either side. Short rates should eventually come down nearer to the rate of inflation, so optimism about the yield curve normalizing makes sense, which I believe will make 2-5 year bonds the most attractive over the next year.
Stock Market Update
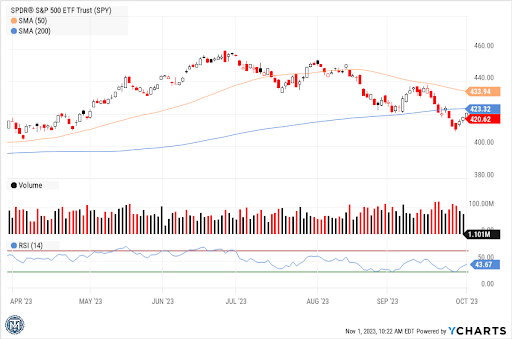
When the S&P 500 broke through support last week near 4200, it increased the odds of a new bear market beginning. That said, it would be unusual for this to play out in the November-December period. This is typically a strong time of the year, and you would have to go back to 2018, 2008, or 2000 to find pronounced weakness at this time of year. I had expected support to hold above 4200 and the S&P 500 to eventually challenge all-time highs (4800) in the first half of 2024. I am now very skeptical that this will happen. I believe the best case now is probably the end of July highs near 4600, because the market will have to expend more energy just getting back to the right side of the 200-day moving average. Falling to 4000 or less is not out of the question.
[1] Most of the money you make from a stock investment comes from the stock or its industry or its market being re-rated (adjusted upward to reflect better conditions than were previously assumed). De-rating is the opposite of re-rating. ↩︎
[2] Best case, rates tend to average 1% over inflation. When inflation is uncontained and/or a country is running unsustainable fiscal or monetary policy, investors demand a higher “margin of safety”. ↩︎
Disclosure
Past performance is no assurance of future results. Trademark Financial Management, LLC (“Trademark”) is a registered investment adviser with its principal place of business in the State of Minnesota. Trademark and its representatives are in compliance with registration requirements imposed upon investment advisers by those states in which Trademark operates. Trademark may only transact business in those states in which it is registered or qualifies for an exemption or exclusion from registration. This newsletter is limited to the dissemination of general information pertaining to its investment advisory/management services. Any subsequent, direct communication by Trademark with a prospective client shall be conducted by a representative that is either registered or qualifies for an exemption or exclusion from registration in the state where the prospective client resides. A complete list of all recommendations will be provided if requested for the preceding period of not less than one year. It should not be assumed that recommendations made in the future will be profitable or will equal the performance of the securities in this list. Opinions expressed are those of Trademark Financial Management and are subject to change, not guaranteed and should not be considered recommendations to buy or sell any security. For information pertaining to the registration status of Trademark please contact Trademark at (952) 358-3395 or refer to the Investment Adviser Public Disclosure web site (www.adviserinfo.sec.gov).
For additional information about Trademark, including fees and services, send for our disclosure statement as set forth on Form ADV from us using the contact information herein or by calling 952-358-3395. Please read the disclosure statement carefully before you invest or send money. Any reference to a chart, graph, formula, or software as a source of analysis used by Trademark Financial Management staff is one of many factors used to make investment decisions for your portfolio. No one graph, chart, formula, or software can in and of itself be used to determine which securities to buy or sell, when to buy or sell them, or assist any person in making decisions as to which securities to buy or sell or when to buy or sell them. Any chart, graph, formula, or software used is limited by the data entered and the created parameters. The data was obtained from third parties deemed by the adviser to be reliable. Nonetheless, the adviser has not verified the results and cannot be assured of their accuracy.
Trademark Financial Market Update – August 23, 2023
1) The US dollar continues to rise, suggesting a “risk-off” approach for global markets (and risk assets in general). Beyond that, the period from the last ten days of August through the first three weeks of September tends to be very weak. Now, in any environment at least some sectors will perform decently but that said, there are environments in which investors should focus on loss reduction, not capital appreciation. These periods give you a chance to figure out what you’d like to own if the price was reasonable, and you wait for prices to fall into your range.
2) The upcoming summit at Jackson Hole, Wyoming (August 24-26) and Nvidia’s upcoming earnings announcement (August 24) are what is moving the market right now. On the former, the market wants confirmation that Fed chairman Powell would respond to declining inflation by cutting rates next year. Of course, Powell doesn’t want to promise anything. He has been largely successful in curbing inflation without causing a recession so far, so he is not likely to feel too concerned with Wall Streeters demanding lower rates. His “Achilles Heel” at this point is the financial sector. He doesn’t want to put any more stress on banks which are already reeling from higher deposit costs and the deteriorating value of their assets (loans, bonds, and mortgages written during lower yield periods). That is really the only thing that could force him to do something he doesn’t want to do. As for Nvidia, all I can say is that north of $460 (55 times next year’s earnings), its earnings and forward guidance need to be WAY better than expected.
3) I’ve been asked why bond yields are rising at the same time inflation is coming down. There are a couple of reasons:
• As of August 16th, The Atlanta Federal Reserve’s GDPNow model estimate for real GDP growth in the third quarter of 2023 is 5.8 percent, up from 5.0% on August 15th. This is way ahead of expectations and if it holds, absolutely prevents the Fed from cutting rates (lest inflation be re-ignited).
• The U.S. Treasury has increased the amount to be borrowed in upcoming Treasury auctions, especially at the longer end of the maturity spectrum, as a result of the growing debt and the cost of servicing it. Fitch downgraded U.S. government debt from AAA to AA+. It is likely that over time this means debt funding costs will rise, but more importantly, the more the U.S. government borrows, the less savings will remain for other borrowers to compete over. Since debt is usually priced at a spread over Treasuries (theoretically the safest debt), private borrowers will be forced to pay higher interest rates.
At the end of the day, it will be harder for rates to come down absent a real economic crisis, and any meaningful rate cut due economic weakness is unlikely to be maintained for long.
4.) The average Chinese stock is off just under -13% this month. This is twice the average loss of EM ex-China. Latin America is down -7%, but India is only off -2.5%. Europe is off -5.5% and Japan -5%. Global investment composites may well be underweight India, given its growth and strong relative performance.
5.) We keep being told by investment strategists that high yield debt is unattractive because spreads over Treasuries are on the narrow side historically and the economy is bound to deteriorate under the weight of high interest rates and reduced Fed liquidity. Meanwhile, high yield and floating rate below investment grade debt continue to over-perform dramatically. The iShare High Corporate Bond ETF, HYG, is up 4.20% YTD, while AGG has gone negative (-0.04%).1 If high yield bonds are essentially a hybrid of stocks and bonds, in this environment high yield debt may, and probably should, draw money away from both bonds and stocks.
[1] As of market close on 8/22/23. Source: YCharts.com ↩︎
Disclosure
Past performance is no assurance of future results. Trademark Financial Management, LLC (“Trademark”) is a registered investment adviser with its principal place of business in the State of Minnesota. Trademark and its representatives are in compliance with registration requirements imposed upon investment advisers by those states in which Trademark operates. Trademark may only transact business in those states in which it is registered or qualifies for an exemption or exclusion from registration. This newsletter is limited to the dissemination of general information pertaining to its investment advisory/management services. Any subsequent, direct communication by Trademark with a prospective client shall be conducted by a representative that is either registered or qualifies for an exemption or exclusion from registration in the state where the prospective client resides. A complete list of all recommendations will be provided if requested for the preceding period of not less than one year. It should not be assumed that recommendations made in the future will be profitable or will equal the performance of the securities in this list. Opinions expressed are those of Trademark Financial Management and are subject to change, not guaranteed and should not be considered recommendations to buy or sell any security. For information pertaining to the registration status of Trademark please contact Trademark at (952) 358-3395 or refer to the Investment Adviser Public Disclosure web site (www.adviserinfo.sec.gov).
For additional information about Trademark, including fees and services, send for our disclosure statement as set forth on Form ADV from us using the contact information herein or by calling 952-358-3395. Please read the disclosure statement carefully before you invest or send money. Any reference to a chart, graph, formula, or software as a source of analysis used by Trademark Financial Management staff is one of many factors used to make investment decisions for your portfolio. No one graph, chart, formula, or software can in and of itself be used to determine which securities to buy or sell, when to buy or sell them, or assist any person in making decisions as to which securities to buy or sell or when to buy or sell them. Any chart, graph, formula, or software used is limited by the data entered and the created parameters. The data was obtained from third parties deemed by the adviser to be reliable. Nonetheless, the adviser has not verified the results and cannot be assured of their accuracy.
Trademark Financial Market Update – March 2, 2023
I am inclined to see the stock market as a tug of war between bullish (upward) and bearish (downward) impulses. During a bull market, the upward impulses drive us to new highs whereas the downward ones always fizzle out at a level higher than the previous downward impulse. In a bear market, just the opposite would be true. Today we are in neither. December’s failure to generate a lower low followed by January’s surge above November’s high suggests that at least for the time being the bear market is over. That said, one modestly higher high and one modestly higher low does not scream trend change. If the mid-August high around 4315 were to be broken through, then I believe we can talk about being in a bull market again.
At the very least, every impulse needs to fulfill a minimum objective or else it becomes suspect. The recent downturn took us under 4000 on the S&P 500 and under its 50-day moving average, so even though we’re less than 5% off of highs so far, it does not count as a failed breakdown (which would have bullish implications). That said, it has failed to meaningfully reverse the very sharp outperformance of growth over value in January which itself has bullish implications. Thus, while the balance of technical indicators are neutral right now, I’d lean to the bullish side.
Changing over to the fundamental side, I am less optimistic. The yield curve is inverted and becoming more so, and the trend of interest rates is higher. In an environment where the supply of goods and labor is more constrained than it was in the 2010s, and demand is greater, it is difficult to believe that consumer prices will both fall and stay at lower levels absent a full-blown recession (which I don’t see right now). Earnings are estimated to have fallen -4% year over year (the bulk of 4th quarter reports are already in). If estimated 2023 earnings are in the $215 range, today’s S&P 500 at 3985 implies a P/E of 18.5 – historically rich for a 4%+ inflation environment. Let’s put fundamentals and valuation in the mildly bearish camp.
If there were a sector I expected to do well in this environment it would be financial services – more specifically, banks. Their cost of deposits is low as savers are still generally willing to accept fairly meagre rates while they (banks) can turn around and receive much higher rates lending it out. In order not to like banks you would have to believe this unusually large funding spread is going to be offset by pending large loan losses, and I just don’t see that. What the market does think it wants today is semi-conductors. Partially due to AI, and partially due to the idea that the current drop in chip demand (relative to supply) won’t last, this area has done very well (19%) this year. Consider me a skeptic, because in my view those stocks have run too far ahead of fundamentals.
I am also surprised at how much investors seem to hate “risk-off” industries like utilities and health care so far this year. Higher interest rates are a headwind for utilities because it increases the cost of their debt and it makes their dividends less valuable, but to offset these costs they will likely ask regulators if they can charge customers higher rates and receive this request. Although investors have thus far punished managed care and pharma stocks, I don’t see a bear case for them that would result in continued underperformance.
Lastly, I feel ambivalent about foreign stock and bonds right now. They had a very good 4 month move due to the weaker dollar but as the dollar has firmed up this month, foreign outperformance has stalled. Not reversed, just stalled. Europe is still doing slightly better than the U.S., but Asia has been underwhelming. Too much in the latter area depends on guessing what China is going to do.
Disclosure
Past performance is no assurance of future results. Trademark Financial Management, LLC (“Trademark”) is a registered investment adviser with its principal place of business in the State of Minnesota. Trademark and its representatives are in compliance with registration requirements imposed upon investment advisers by those states in which Trademark operates. Trademark may only transact business in those states in which it is registered or qualifies for an exemption or exclusion from registration. This newsletter is limited to the dissemination of general information pertaining to its investment advisory/management services. Any subsequent, direct communication by Trademark with a prospective client shall be conducted by a representative that is either registered or qualifies for an exemption or exclusion from registration in the state where the prospective client resides. A complete list of all recommendations will be provided if requested for the preceding period of not less than one year. It should not be assumed that recommendations made in the future will be profitable or will equal the performance of the securities in this list. Opinions expressed are those of Trademark Financial Management and are subject to change, not guaranteed and should not be considered recommendations to buy or sell any security. For information pertaining to the registration status of Trademark please contact Trademark at (952) 358-3395 or refer to the Investment Adviser Public Disclosure web site (www.adviserinfo.sec.gov). For additional information about Trademark, including fees and services, send for our disclosure statement as set forth on Form ADV from us using the contact information herein or by calling 952-358-3395. Please read the disclosure statement carefully before you invest or send money. Any reference to a chart, graph, formula, or software as a source of analysis used by Trademark Financial Management staff is one of many factors used to make investment decisions for your portfolio. No one graph, chart, formula, or software can in and of itself be used to determine which securities to buy or sell, when to buy or sell them, or assist any person in making decisions as to which securities to buy or sell or when to buy or sell them. Any chart, graph, formula, or software used is limited by the data entered and the created parameters. The data was obtained from third parties deemed by the adviser to be reliable. Nonetheless, the adviser has not verified the results and cannot be assured of their accuracy.
Trademark Financial Market Update – August 29, 2022
1) The big news today was always going to be the market reaction to Fed Chairman Powell’s Jackson Hole Speech. Powell wasn’t trying to move the stock market (even though he knew he would), but the market had run hard on the idea that he was close to moving back to a neutral stance on interest rates. He firmly disabused stock investors of this notion today. Theoretically investors can fight the Fed (if they believe the Fed is in a corner and has to pivot), but this is dangerous because the Fed has a lot of tools at its disposal. The summer rally was an attempt to front-run a Fed pivot from hawkish to neutral, and if today is any indication it will fail miserably.
2) I believe China’s upcoming National Congress is something far more significant to the world than what the Fed said today. This is expected to take place this November, though the exact date has not been confirmed. Xi Jinping is attempting to become, effectively, president for life. Power in the hands of one person is not generally investor-friendly, especially not a person with little love for messy, diffuse, unpredictable nature of free markets. Expect Chinese markets to trade as a proxy on Ji’s prospects, with market weakness a sign of Xi being more likely to consolidate all power. If Xi ultimately does not prevail, expect an explosive move to the upside – in China certainly but also to a lesser degree in other emerging markets.
3) From Wisdom Tree, a breakdown of the investable world:
• 61% United States
• 28% Developed EAFE (16% Europe, 6% Japan, 3% Canada, 3% Australia & NZ)
• 11% Emerging Markets (3% Taiwan+S. Korea; 4% China w/Singapore & HK; 2.6% So. Asia, 1.4% Africa & Middle East) This is what Vanguard’s index and target date funds reflect. It has been fairly easy over the past 12 years to outperform global benchmarks by overweighting the United States. Though the benchmark calls for 39% of equity holding to be outside the U.S., we have almost always been between 24% and 30% over the past decade. We are around 26% today, but with absolutely everything going wrong for foreign markets lately the potential upside to a lessening of global strife in terms of lower inflation, cheaper energy, and a weaker dollar could be enormous.
• Energy had a very good week on news of a larger-than-expected drawdown in national oil reserves. Regard this as a volatile series; the next weekly report could easily show more reserves than forecast. It is true that we have under-invested in energy over the 2016-2021 time period, but we are making up for that now and oil is being hoarded in some areas. We might well see prices fall as a temporary glut is resolved before the primary trend continues higher. Today is not the time to buy.
• One of the big reasons for the 1H22 market decline was the expectation that corporate profit margins would fall due to rising labor and materials costs. If the results from the most recent earnings season are any indication, however, companies are fairly easily passing those costs on. This may be bad for consumers and bond investors (persistent higher inflation), but its good news for stock prices. This has been a catalyst for US stocks since earning season began around July 18th. Earnings season is almost over now, so this tailwind has less impact now versus the strong headwind of a resolute Fed.
Disclosure Past performance is no assurance of future results. Trademark Financial Management, LLC (“Trademark”) is a registered investment adviser with its principal place of business in the State of Minnesota. Trademark and its representatives are in compliance with registration requirements imposed upon investment advisers by those states in which Trademark operates. Trademark may only transact business in those states in which it is registered or qualifies for an exemption or exclusion from registration. This newsletter is limited to the dissemination of general information pertaining to its investment advisory/management services. Any subsequent, direct communication by Trademark with a prospective client shall be conducted by a representative that is either registered or qualifies for an exemption or exclusion from registration in the state where the prospective client resides. A complete list of all recommendations will be provided if requested for the preceding period of not less than one year. It should not be assumed that recommendations made in the future will be profitable or will equal the performance of the securities in this list. Opinions expressed are those of Trademark Financial Management and are subject to change, not guaranteed and should not be considered recommendations to buy or sell any security. For information pertaining to the registration status of Trademark please contact Trademark at (952) 358-3395 or refer to the Investment Adviser Public Disclosure web site (www.adviserinfo.sec.gov). For additional information about Trademark, including fees and services, send for our disclosure statement as set forth on Form ADV from us using the contact information herein or by calling 952-358-3395. Please read the disclosure statement carefully before you invest or send money. Any reference to a chart, graph, formula, or software as a source of analysis used by Trademark Financial Management staff is one of many factors used to make investment decisions for your portfolio. No one graph, chart, formula, or software can in and of itself be used to determine which securities to buy or sell, when to buy or sell them, or assist any person in making decisions as to which securities to buy or sell or when to buy or sell them. Any chart, graph, formula, or software used is limited by the data entered and the created parameters. The data was obtained from third parties deemed by the adviser to be reliable. Nonetheless, the adviser has not verified the results and cannot be assured of their accuracy.
Summary
The second quarter was a difficult one for stocks, as the S&P 500 plunged -16.1%. 1 In fact, we’d have to go back to the first quarter of 2020 to find a worse quarter (-20.0%). Beyond that, we’d have to go to the fourth quarter of 2008, so you can see that quarters this bad tend to occur very infrequently. That this quarter’s loss followed a -5.5% first quarter decline makes it all the more painful. That it didn’t occur as a result of a recession makes it somewhat unusual. It is probably more analogous to a speculative bubble being burst, like in 2000, than anything that happened in 2008 or 2020. I’ll have thoughts on where we go from here later on in this report.
From a stock standpoint, things were either bad, not that bad, or really bad. Technology was right in the crosshairs of the decline as unrealistic future growth expectations ran headlong into rising inflation. This sector shed -19.8% last quarter, bringing its year-to-date return to -26.6%.2 Technology is the largest sector of the market, especially for ESG portfolios, so losses there had an impact that one could hardly avoid. Technology stocks had been the best performers prior to Covid and the best performers during the Covid recovery period. While emerging tech peaked in February 2021, the big names – Apple, Microsoft, Nvidia, etc. – were still making new highs in the 4th quarter of last year. Those stocks had been close to “bullet-proof” for many years, so they were over-represented in mutual fund and ETF portfolios even though they had become quite expensive. In the first quarter of 2022, energy and materials stocks picked up the slack from the tech sector. Through the middle of May energy stocks rose more than 40%. Then they corrected viciously, falling more than -17% in June.3
Neither developed markets outside the U.S. nor emerging markets provided any relief either. Europe lost -14.6%. Asia ex-Japan lost -16.3%. Japan dropped over -20%4 in dollar terms, as the yen nosedived against the U.S. currency. Wherever one went outside the U.S., the inflationary effects of a very strong dollar depressed economic activity. China has picked up the slack in the past, but China’s ineffective vaccine and draconian quarantining policy has prevented them from being an economic stimulus for the world this time.
Bonds didn’t provide any shelter either. The Bloomberg Aggregate Bond Index was off another -4.7% last quarter, bring the year-to-date decline to -10.4%.5 Inflation continues to be a headwind for the bond market; with current yields below the rate of inflation, bond investors lose purchasing power even if interest rate don’t rise any further. Some bonds have value as “ballast” because long duration, high quality bonds often rise when stocks fall. This is more common in deflationary environments than inflationary ones, however, since high quality bond price gains are a signal that the Federal Reserve is likely to address economic weakness by cutting interest rates. Today inflation is high, so the Fed cannot cut rates even if the economy stalls.
Finally, there is gold. The perfect environment for gold, theoretically, is a situation where the central bank (Federal Reserve) creates too much credit, fails to tighten credit when inflation begins to get established, and forces investors to accept steeply negative returns on their savings. Therefore, this should have been a fantastic year for gold. Instead, it has managed to lose about -6%.6 Truly, this has been a difficult environment for investors. That said, One Thing That Cannot be Stressed Enough… Consumer Sentiment Index and Subsequent 12-month S&P 500 Returns
Source: JPMorgan Guide to the Markets – US, Slide 25. Data are as of June 30,2022
Peak is defined as the highest index value before a series of lower lows, while a trough is defined as the lowest index value before a series of higher highs. Subsequent 12-month S&P 500 returns are price returns only, which exclude dividends. Past performance is not a reliable indicator of current and future results.
The graphic above shows consumer sentiment over the past 50 years with 8 distinct peaks and troughs noted and how much the S&P 500 gained or lost in the 12 months following. On average, buying at a confidence peak returned 4.1% while buying at a trough returned 24.9%. Such an outcome may be counter intuitive, but it highlights the fact that investors tend to extrapolate the most recent trend into the future.
This is not to suggest that U.S. stocks will return anything like 24.9% in the year ahead, as many other factors will determine that outcome. However, it does suggest that investors should focus on things they can control, like maintaining a long-term perspective to avoid reactive selling, rather than investing based on how they feel about the world. The point is, you CANNOT outperform by selling after the market has made a major decline, and you rarely outperform by getting aggressive late into a bull market. JP Morgan is widely reported to have said “In bear markets, stocks return to their rightful owners”. His point was that most people make money during bull markets but give back most, all, or all-and-then-some during the bear phases. I have to believe that at today’s low sentiment levels, were he here, Mr. Morgan would be a buyer.
Activity
The first thing to remember is that stock prices reflect current liquidation value of a company plus all the future cash flow that the company is expected to generate over its lifetime, discounted by future expected inflation rates.7 The higher inflation is, the more you have to discount a dollar you expect to earn in the future. Many companies in the airline, utility, mining, real estate, and financial services industries grow at sub-5% rates, so most of their value is in what you could liquidate them for. On the other hand, companies in biotechnology, clean energy, cybersecurity, and the like are expected to earn far more in the future than they do today. These stocks are therefore far more sensitive to expected future inflation rates. They are the ones that have been hurt the most this year, but they are also the ones that stand to gain the most once the market believes that inflation has peaked.
Up to the end of May, we believed that we were in a rising inflation environment, so we made changes to increase the exposure to companies in the former group while trimming the latter. Recently, the market seems to feel that it might be time to “bottom-fish” those high growth companies as inflation moderates. Our feeling is that we’d like to be neutral on this question. We cannot predict future inflation, and we’ve not met anyone else who has shown consistently that they can.
During down markets, one tends look at returns in an absolute sense as opposed to a relative one. For example, a stock fund that lost only -11% last quarter would have been a big winner relative to the market’s -16%, but it still reduced one’s wealth in an uncomfortable way. In a bear market we look for absolute winners – funds that are able to hold or modestly improve their value – as relative wins become less appetizing. To that end we increased exposure to private real estate, long dollar, and merger arbitrage funds. We also held a little more cash in portfolios. At some point, higher inflation will lead to higher money market rates.
Outlook
For several years I have written reports that explained the strong stock market performance with the caveat that stocks were overvalued versus historical measures, and therefore future returns would not be as strong. Of course, I didn’t know when stocks would sell off or by how much, because that is unknowable.
Let’s play a thought experiment. Think of annual stock returns as individual marbles in a bag of forty total marbles, representing forty years.8 In the bag are black and grey marbles, representing large and small gains, respectively. Also present are red and pink marbles, representing large and small losses. In the bag, black and grey marbles outnumber red and pink marbles by a two to one margin which is roughly equivalent to the ratio of up to down years in the stock market. 2008 was the last red marble year. Going thirteen years without drawing a red one kind of makes one overdue. The “red marble” year could have been 2020 when Covid ravaged the world, but unprecedented fiscal action (otherwise known as stimulus checks) reversed the first quarter decline. It could have been 2021 when stimulus ran out, inflation started to accelerate, and high-flying work-from-home stocks came crashing down to earth, but thanks to an incomprehensibly accommodative Federal Reserve, prices for the market leaders managed to stay in the black (elevated) to the end of the year.
Many investors are sure that we have drawn a red marble here this year. Our feeling is that forward stock multiples have now contracted to a level that would allow for decent future returns if corporate earnings expectations can remain around current levels. A moderation in inflation to the 4-5% range and less Fed policy uncertainty could very well turn 2022 from a red to a pink marble year.
Commentary – How Did We Get Here?
I will discuss how the U.S. got into the inflationary mess that it is in right now, with the hope that understanding it will help lead to better outcomes. In doing so, it is important to separate systematic mistakes (which are foreseeable, avoidable, and correctable) from shocks (which are unexpected crises which central banks and political leaders cannot anticipate and therefore must react to the best they can). Here is how we got here:
1. Federal Reserve Overstimulation – Going back to the end of the Great Financial Crisis in 2009, prominent economists warned about “secular stagnation”. Stated simply, this was the idea that because of the massive amount of debt that we took on to emerge from that crisis, America was going to experience very low growth and deflationary pressures until we could pay down that debt. Fearful of falling back into a recession, the Federal Reserve opted to keep rates near zero to generate modestly positive economic growth. Inflation flared a tiny bit in 2013, 2015, and 2018, but each time a small amount of tightening snuffed it out. Key results:
2. The Fed began to believe it could successfully manage inflation, so it didn’t take it seriously.
3. During periods in which economic growth is expected to be modest, investors tended to avoid cyclical industries (energy, materials) preferring to allocate capital to areas with stronger growth prospects (technology, biotech, green energy).
4.Underinvestment in Energy – The energy sector was a terrible investment for much of the 2010s. Overinvestment in prior years led to subpar returns as supply surged in excess of demand. In the middle of the decade many energy companies faced bankruptcy as the revenue generated on $45 per barrel of oil could not service debt incurred at $90/barrel. CAPEX investment then shifted to green energy because interest rates were low enough to tolerate short term losses on the expectation of large long term gains. Many thought oil in the ground might never be exploited because green energy costs would fall enough to make it obsolete, so oil companies focused on efficiency and profitability, not additional production capacity. Europe went so far as to shutter most of its nuclear capacity, and Germany’s former Prime Minister Angela Merkel made a fateful natural gas pipeline pact with Russia. The key result is that the world was dreadfully unprepared for an oil shock.
5.China tensions get worse – As result of Chinese efforts to project more influence upon the world and counter the power of the United States, China begins to exert itself more in the South Asia Sea and in Asia more broadly. The U.S. has been unhappy for more than two decades about Chinese theft of American technology and intellectual property, but as China has grown it has become more of a direct rival. Both countries begin to feel that what benefits one hurts the other, so they increasingly use trade sanctions to punish one another. The result is that the U.S. starts to emphasize domestic re-shoring of manufacturing, which is inflationary because labor costs are higher here. That was the background as 2020 began. Now the shocks:
6.Covid strikes – The global pandemic takes a large human and economic toll, but it also affects labor supply and manufacturing patterns. China locks down, attempting to stamp out the disease once and for all. The Chinese vaccine has very low efficacy, however, and the virus is still able to spread and mutate. More than two years later the Chinese population is still subject to rolling lockdowns, and Chinese economic growth has slowed to the lowest level in decades. They can’t supply many of the things the world needs, or if they can, it is late, less than requested, and more expensive. The United States COVID lockdowns are far less severe than China’s, and its vaccines are much more effective. Even so, American workers begin to ask themselves tough questions about the way they are living and working. Many chose to work from home or leave the labor force altogether, leaving Corporate America to deal with a historic worker shortage. In the past, this could have been met by being more open at the borders, but over the past five years this country has scaled back both legal and illegal immigration dramatically. Key results:
7. Empty shelves, higher labor costs, and reduced service hours due to the shortage of workers.
8. Massive economic stimulus in 2020, as U.S. unemployment briefly approached 30%.
9.Federal Reserve blunders – It may well have been very necessary to flood the economy with liquidity in April 2020, and perhaps for several months thereafter. That said, once it was apparent that the checks were fueling a massive consumer spending boom, the Fed should have tried to rein it in by raising interest rates. Instead, the Fed declared the burst of inflation in 2020 “transitory” and continued to pump money into the economy. Unable to go anywhere, people spent their money on their homes or they put it into the stock market, fueling a mania for “stay-at-home” stocks like Zoom Video and Peloton. Initially, this extra demand was great for retailers, but soon they were hard-pressed to meet it given Chinese under-production and American inability to get goods off container ships and into trucks at the port of entry. Retailers raised prices and consumers paid them, so they upped their orders knowing they might not get all they asked for. By the middle of 2021, however, consumers had enough goods. Freed by relatively successful vaccines, they wanted to travel instead. Stay at home stocks began to crater, but with the Fed inexplicably still in expansion mode, excess funds found their way into a narrower group of stocks – technology leaders such as Apple, Microsoft, Amazon, and Nvidia. Key results:
10. Supply chain problems, overly easy monetary policy, and rapidly changing consumer preferences lead to a massive misallocation of capital. Now, goods retailers suddenly have too much inventory as spending moderates toward pre-pandemic patterns.
11.Russia Attacks Ukraine – This touched off #2, the under-investment in energy. With Russian energy effectively off the market in the developed world, this has led to a large gap between supply and demand. Energy prices are off now their highest levels, but it is hard to see prices going much lower as it is difficult to increase production over the short term (and many providers aren’t even sure they want to, fearing a plunge in prices if the war ends). The situation is particularly acute in Europe, which depends on Russian natural gas. The war also affects the global food situation, as Russian and Ukrainian wheat is exported around the world. Rising prices for food in the developing world are leading to political crises; Sri Lanka is the first but unlikely to be the last country that spirals out of control as people vent their frustrations on the government. Key results:
12. War is inflationary. Money is spent on munitions, which are consumed without any benefit to the economy. Even in an economic slowdown, national debt grows. So here we are. We got away with two decades of an incoherent China policy, overly expansive money policy for a decade, several years of underinvestment in energy, and a poorly thought-out immigration policy throughout several administrations until suddenly the chickens came home to roost.
All of that said, we have the ability to make use of this economic downturn. Almost every economist has written in some manner about the cleansing function of recessions. In fact, it can be argued that times of difficulty are the ONLY times that people are willing to make sacrifices for the long term good. Europe is beginning the painful process of weaning itself off Russian energy. America has an opportunity to address the causes of this downturn on a bipartisan basis precisely because both parties and multiple Federal Reserve Governors have their fingerprints all over the failures. America’s tough financial decisions in the wake of the Great Depression set it up to be the pre-eminent economic power of the 20th century (which enabled it to also be the pre-eminent military power). I hope we will rise to meet this challenge as well. If we can, I would be very bullish on us in the coming decades.
[1] S&P 500 with dividends included, per Morningstar Workstation ↩︎
[2] Technology sector ETF, per Morningstar Workstation ↩︎
[3] Energy sector ETF, per Morningstar Workstation ↩︎
[4] MSCI Europe, Asia Ex Japan, Japan Total return in US dollars, per Morningstar Workstation ↩︎
[5] Bloomberg Aggregate Bond Index, per Morningstar Workstation ↩︎
[7] Each dollar earned in 2028 is worth 88.6 cents at a 2% inflation rate; at 6% it is worth only 69 cents ↩︎
[8] 40 was chosen because the drawing out a particular color does change the odds modestly. A bag of 40 might have 10 pink and 3 red marbles, so as you draw out black, grey, and pink marbles the odds of red increases (much like a long period of high stock returns makes the market more and more expensive, setting the stage for a disappointing year or two). If the bag is infinite, the drawing of any color marble doesn’t change the odds. ↩︎
DISCLOSURE Past performance is no assurance of future results. Trademark Financial Management, LLC (“Trademark”) is a registered investment adviser with its principal place of business in the State of Minnesota. Trademark and its representatives are in compliance with registration requirements imposed upon investment advisers by those states in which Trademark operates. Trademark may only transact business in those states in which it is registered or qualifies for an exemption or exclusion from registration. This newsletter is limited to the dissemination of general information pertaining to its investment advisory/management services. Any subsequent, direct communication by Trademark with a prospective client shall be conducted by a representative that is either registered or qualifies for an exemption or exclusion from registration in the state where the prospective client resides. A complete list of all recommendations will be provided if requested for the preceding period of not less than one year. It should not be assumed that recommendations made in the future will be profitable or will equal the performance of the securities in this list. Opinions expressed are those of Trademark Financial Management and are subject to change, not guaranteed and should not be considered recommendations to buy or sell any security. For information pertaining to the registration status of Trademark please contact Trademark at (952) 358-3395 or refer to the Investment Adviser Public Disclosure web site (www.adviserinfo.sec.gov). For additional information about Trademark, including fees and services, send for our disclosure statement as set forth on Form ADV from us using the contact information herein or by calling 952-358-3395. Please read the disclosure statement carefully before you invest or send money. Any reference to a chart, graph, formula, or software as a source of analysis used by Trademark Financial Management staff is one of many factors used to make investment decisions for your portfolio. No one graph, chart, formula, or software can in and of itself be used to determine which securities to buy or sell, when to buy or sell them, or assist any person in making decisions as to which securities to buy or sell or when to buy or sell them. Any chart, graph, formula, or software used is limited by the data entered and the created parameters. The data was obtained from third parties deemed by the adviser to be reliable. Nonetheless, the adviser has not verified the results and cannot be assured of their accuracy.