U.S. stocks added another 2.6% last quarter, bringing its full year return to 17%.1 It was a rather subdued quarter compared to the previous three quarters, and once again international stocks performed substantially better. Investors felt a little more cautious about technology stocks last quarter as concerns grew as to whether the hundreds of billions being spent on artificial intelligence (AI) would have the kind of payoff that big tech stock prices implied. As the focus shifted to industries that would benefit from AI (versus those that were producing it), health care emerged as a winner. Utilities and real estate continued to struggle because both sectors are seen as beneficiaries of lower long-term interest rates. While the Federal Reserve cut short rates twice, this did not do much to lower mortgage rates.2 Investors are trying to figure out the economy in which profits are rising quite nicely but this isn’t leading to more job creation.3
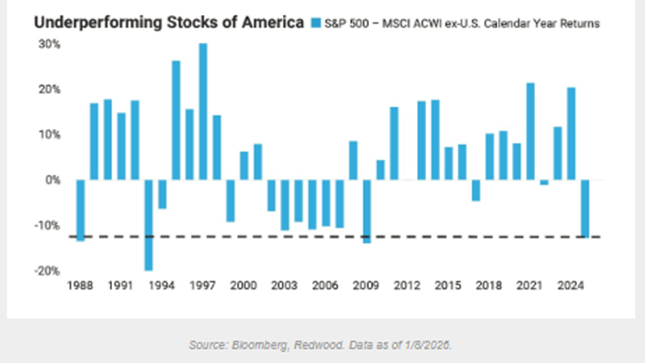
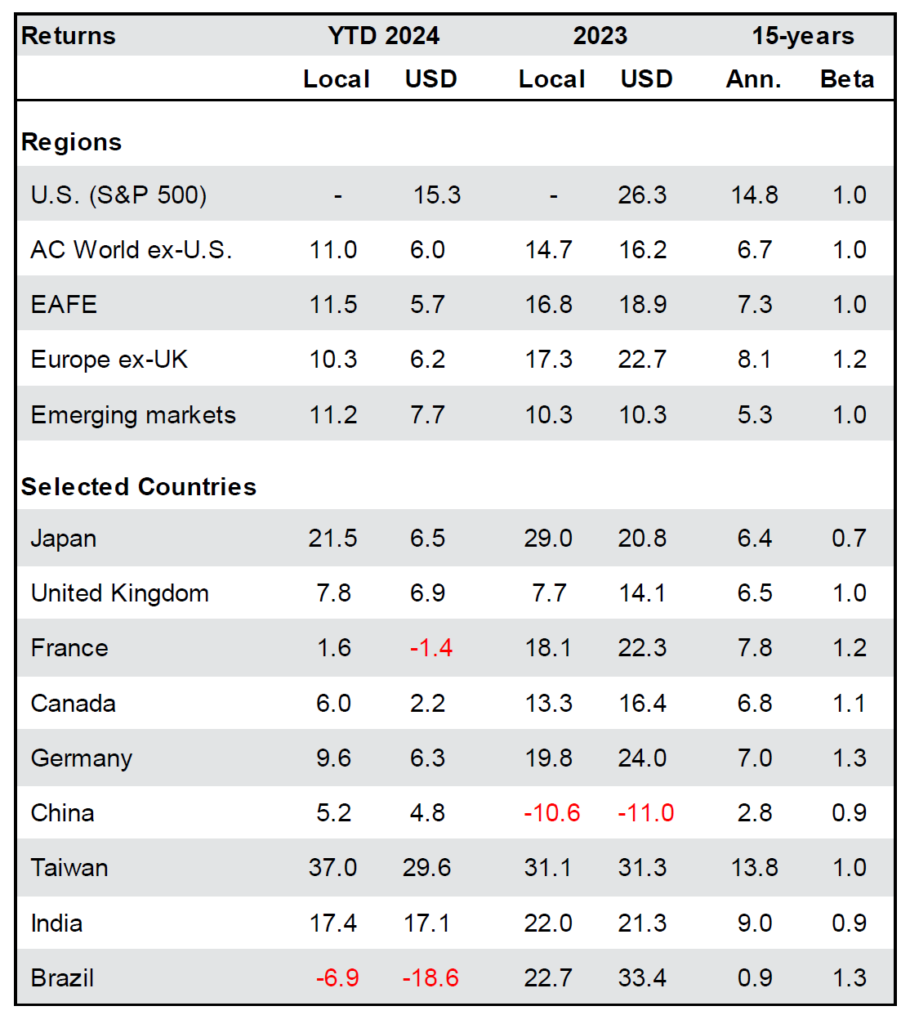
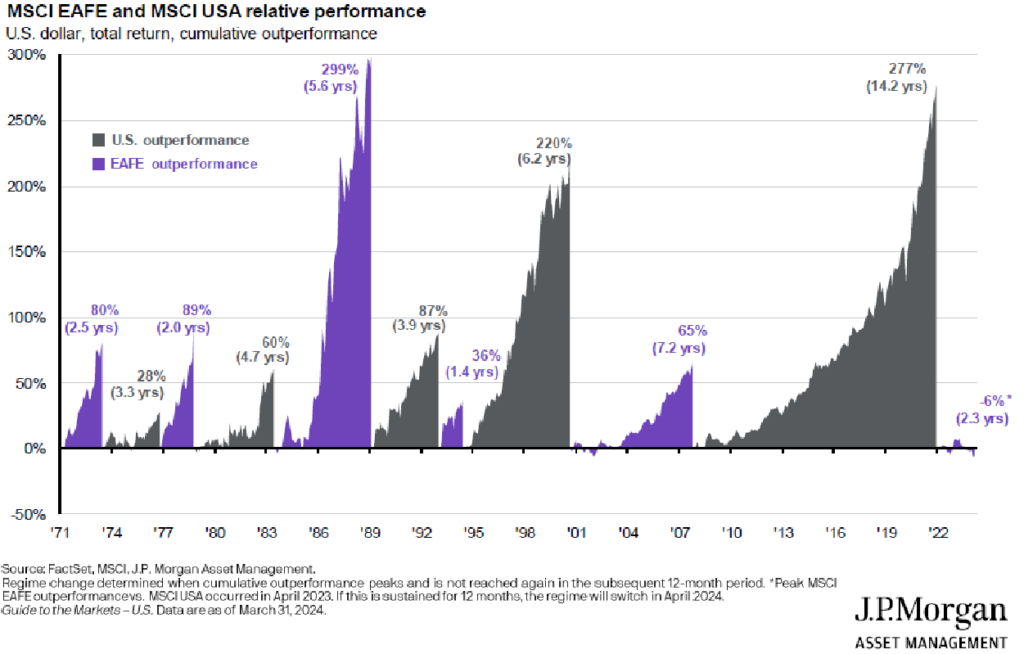
For several years we have been saying that international stocks are cheaper, but until this past year that really didn’t matter. For U.S. investors, the strength of the dollar tended to cancel out much of the gains foreign markets made in the local currency. Last year both factors needed to produce better foreign stock returns occurred; the dollar fell against most foreign currencies and local market stock performance was strong enough to close some of that huge fifteen-year performance gap. Overall, foreign stocks rose 3.8% last quarter and 33.1% for the full year.4 Brazil, South Korea, Taiwan, Germany and Canada all rose more than twice our 17% gain; India was the real laggard amongst major markets last year.
The U.S. stock market had a great run against foreign markets for dollar-based investors, but it looks like it may be over. Relative investment performance is a metric that tends to trend, and the trend appears to have reversed.
Bonds rose 1.2% during the quarter to end the year up 7.2%. This was the first year since 2020 that investors weren’t better off in short maturity bonds. There was optimism about long term rates coming down in September and October, but that had dissipated by December. The biggest profits on the bond side were in emerging market bonds, which rose about 3% last quarter and 14% for the year. Money market returns were over 4.2% last year, but their annualized rate slipped under 4% by the end of the year.
Commodities were the strongest area of the market last year, specifically the metals sector. Industrial metals rose 15.8% last quarter on increased demand for copper and aluminum for constructions. Precious metals rose 15.6% last quarter and 68% for the year due to unprecedented demand for both gold and silver, having mostly to do with global political instability. Crypto- currency had made some inroads in terms of replacing gold in recent years, but bitcoin’s small loss in 2025 showed that when you really need an alternative to the U.S dollar, only gold will do.
Activity
We reallocated portfolios in late September and October because we felt that the market had successfully navigated the seasonally weak late August through late September period without incident and would reward more aggressive positions to the end of the year. We did not get the kind of “Santa Claus rally” that you get in some years. Defensive industries (utilities, real estate) did underperform those that are more economically sensitive (industrials, transportation), with the exception of health care. We also worked hard from Thanksgiving to the end of the year to minimize capital gains. Since stocks rose by 17% and bonds increased by 7%, there simply weren’t enough losses to offset those gains, so we did our best with what was available. I guess lack of losses is a good problem to have. The other issue we encountered was the rapid increase in the price of gold. We established a 2% position in portfolios many years ago for those occasional periods of instability. It seemed like all of 2025 was a period of instability, and those 2% gold positions become 3-4%. We have been taking profits into strength, with our feeling now that gold should not exceed 3% to 3.5%. At some point that degree of volatility can work against you.
Outlook
Any advisor will tell you that there is never any shortage of opinions about where the market is headed. At the beginning of any year, every major investment firm has a webinar in which they give you their prediction for the year. If they are a product shop (i.e. they sell investments), the predictions will almost certainly be bullish on both stocks and bonds. On the other hand, if they sell research or analytics, they are often overly pessimistic because they feel that negativity makes them seem smarter. We are making no prediction about investment returns this year because we just see too many wild cards out there. Not least of these is the geopolitical and economic objectives of the United States, which seem to change on a weekly basis.
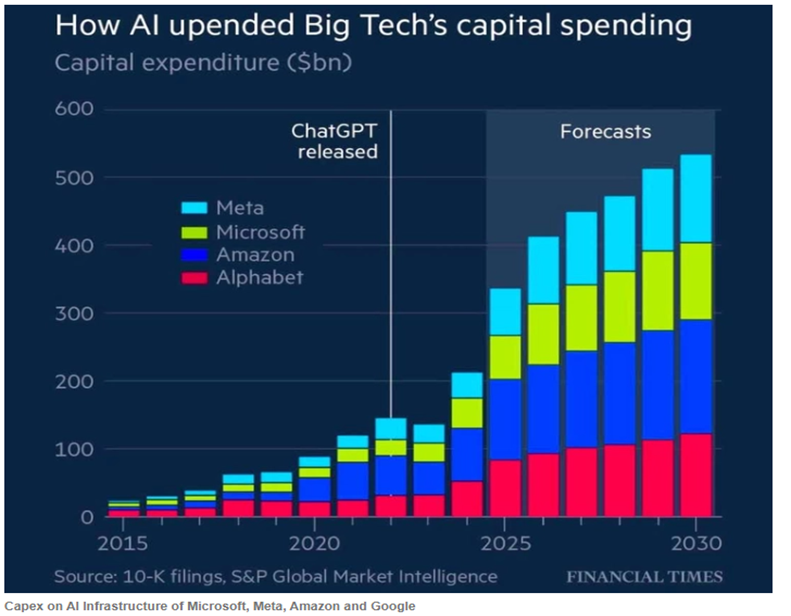
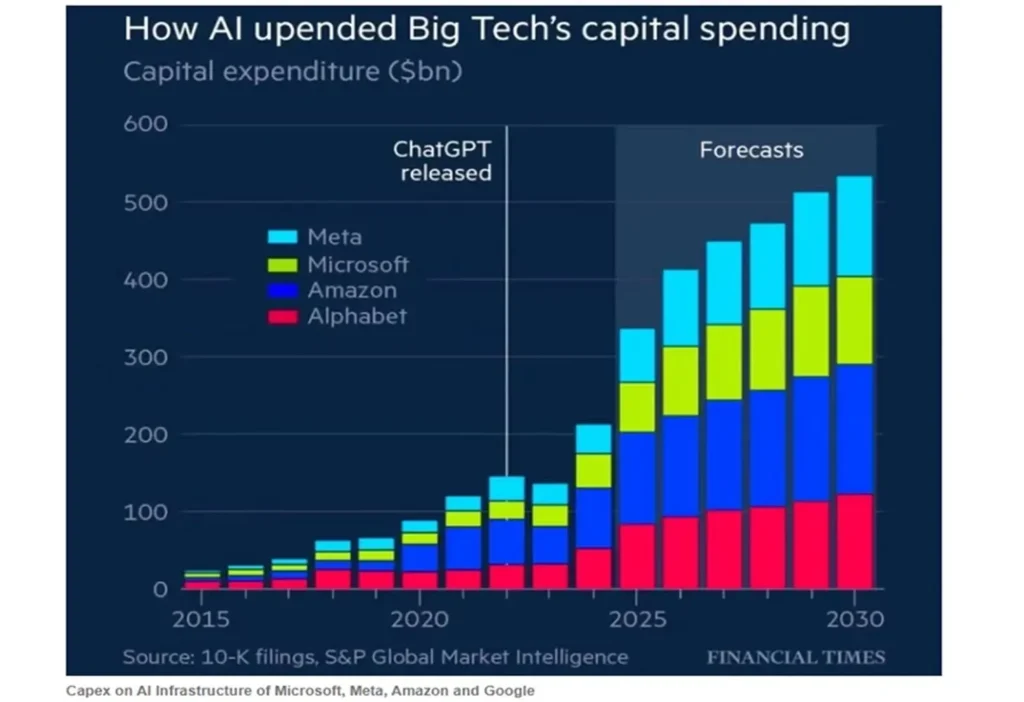
Aside from that, AI spending and future revenues are the biggest unknowns in the market right now. AI is already being used widely in industry to boost productivity, but there is no “killer app” yet. Access to AI at this point is free for writing and editing purposes and is available at a reasonable subscription price for larger entities. That said, it has not reached the “I’ve got to have it whatever it costs” stage that binds you to it and gives providers a large, growing, and reliable income stream.5 This could be a problem because many technology and related stocks are priced on the assumption that the high margin application stage will be reached. Even if AI becomes essential, it’s uncertain whether we could produce enough electricity to power all of the things we expect it to do. So, in a sense we are building the proverbial bridge as we are crossing it.
If this chart is true, then the big technology hyper-scalers will be spending so much money building out their AI programs that they won’t be able to afford much in the way of dividend increases or share buybacks. Stock prices have already begun to reflect concern.
On the positive side, some parts of the market (small caps, emerging markets) that haven’t moved much over the past ten years (and are therefore reasonably priced) have been doing well lately. If there is widespread disappointment with technology profitability, money will probably rotate into other sectors as long as the general economy holds up. Interest rates are the key. If the ten-year note can stay around 4%, we’ll probably be okay this year.
Commentary – Random Thoughts
In the absence of one unifying theme for this commentary, I’d like to present a few quotes and ideas and charts that have interested me lately.
Michael Cembalest is an investment strategist for J.P. Morgan whose research and ideas are “must reading” among financial professional these days. A lot of what I know about the opportunities and challenges of AI are from his writings. There are two things he has written recently that I have noted:
1. “US technology price-to-earnings-growth ratios are only 1-3 times in recent years. In the dot.com era stock prices were 4-8 times expected annual earnings growth”.6 In other words, we have not maxed out at all what investors might pay at the top of the cycle.
2. “After a correction, ask “what could go right” rather than obsessing over factors that led to the selloff. And when markets are highly concentrated and near all-time highs, the right question to ask is “what could go wrong”.7 He is saying that there aren’t enough people thinking today about what might go wrong because every sell-off since 2011 has been an opportunity to buy. At some point, the market will cry wolf and there really will be a wolf.
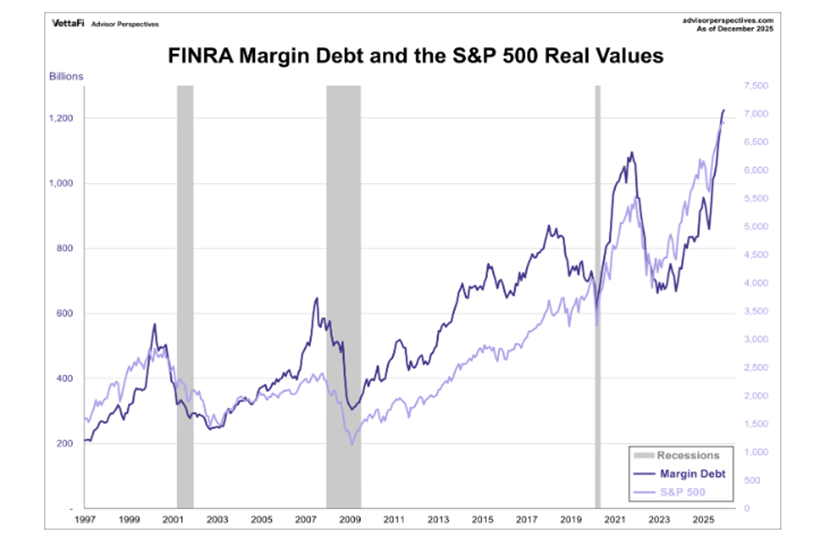
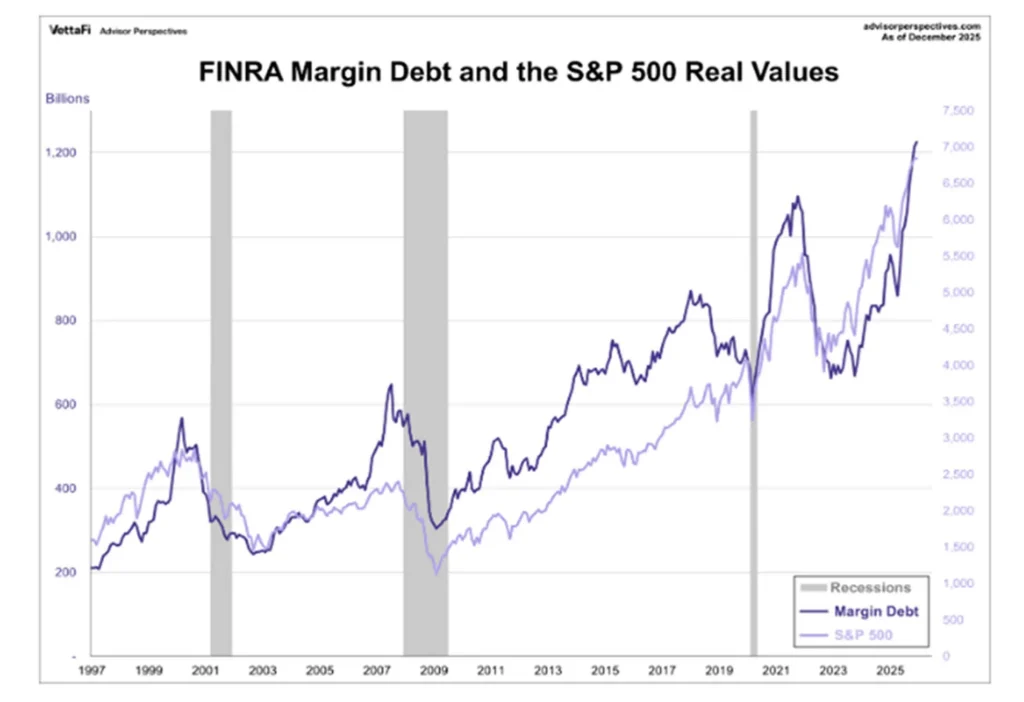
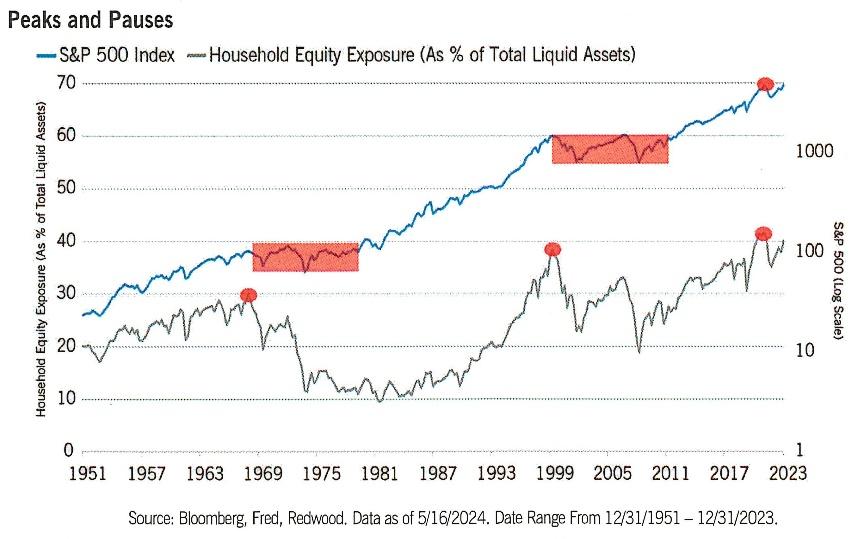
Margin Debt is a measure of how aggressive (leveraged) stock market investors are in aggregate. As you can see, we are at all-time highs. This doesn’t mean we can’t go higher, but it does suggest that the current advance is pretty far extended. When this measure starts to fall, often a recession is not far behind.
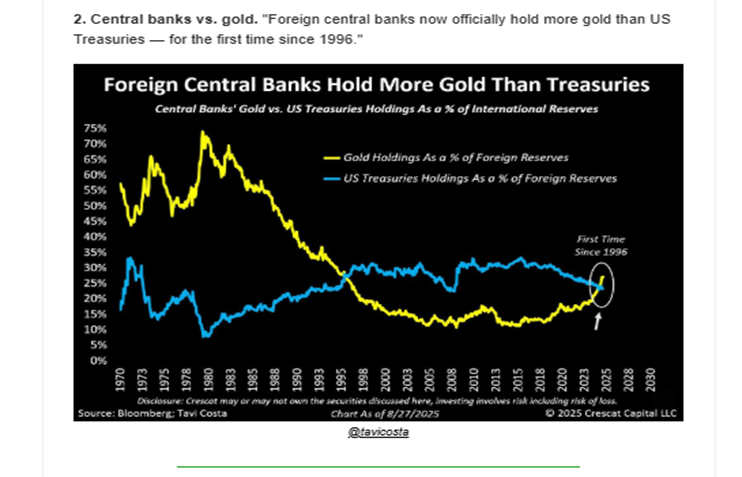
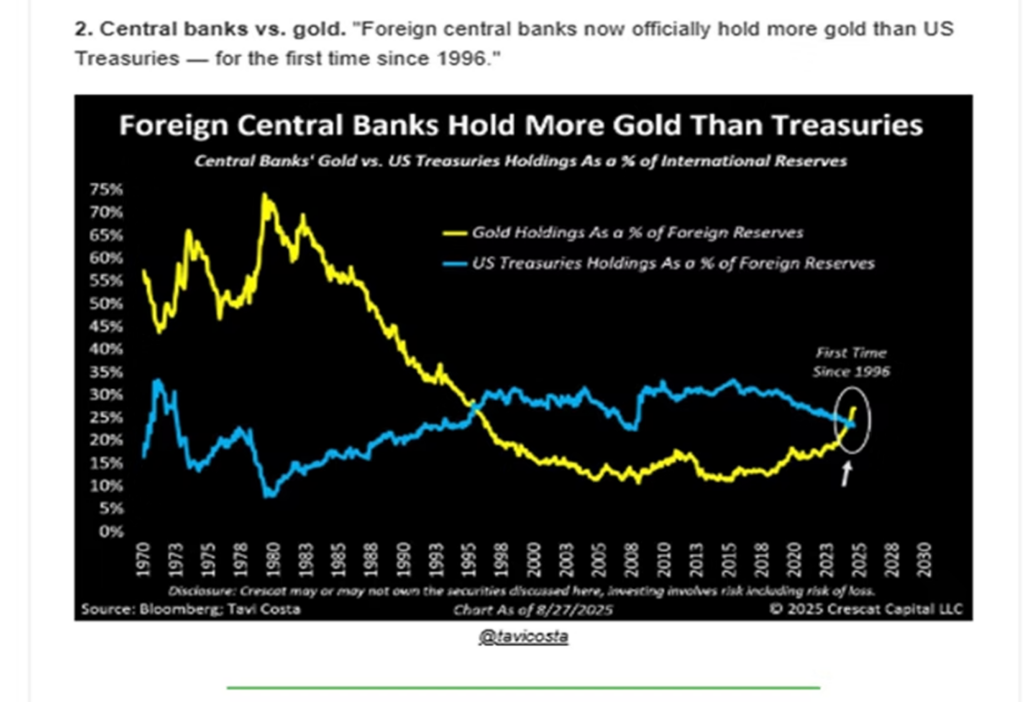
One of the reasons for the big surge in gold prices is the surge is buying by foreign central banks. Why have they been buying gold and selling their U.S. Treasuries? Every country has its own reasons, but China has been trying to diversify away from the dollar since the mid-2010s when the trade war with the U.S. intensified. The sharp move in recent years has to do with widespread fears that the U.S. might seek to punish any country that did not fall in line behind it, much as it punished Russia economically after the Ukraine invasion and Iran before that.
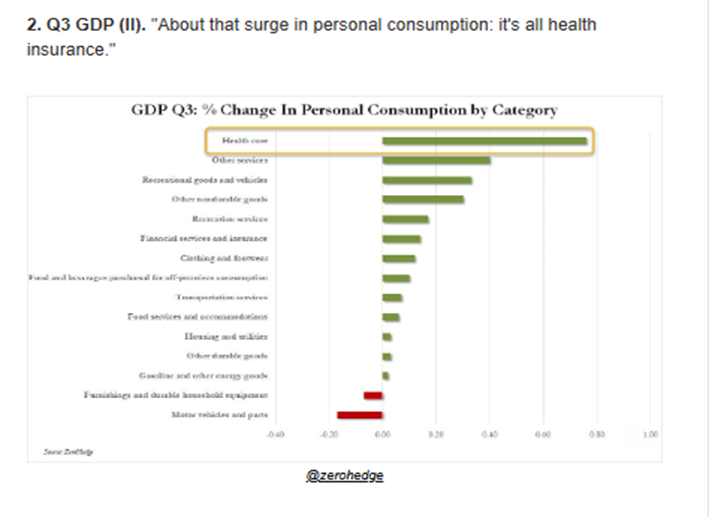
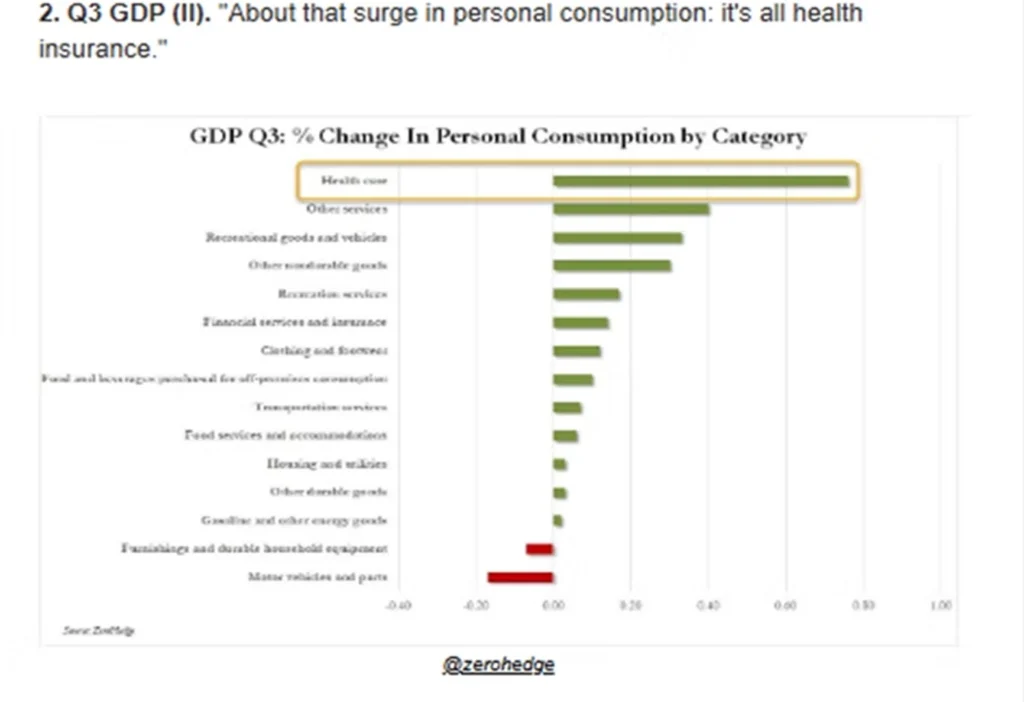
The economy was not as strong last year as it appeared. Largely, GDP rose because we spent more for health insurance.
[1] S&P 1500 U.S. Stock Composite, via Standard & Poors. ↩︎
[2] Because mortgages tend to be tied to it, the ten-year U.S. Treasury is seen as the key to the housing sector. ↩︎
[3] Except in health care, but those are primarily lower wage jobs tied to taking care of senior citizens. ↩︎
[4] JPMorgan Asset Management, Guide to the Market 1Q26. In U.S. dollar terms. ↩︎
[5] Like the iPhone, for instance, or Google. You could use a different phone or search engine, but the network effects of both of these was overwhelmingly powerful. ↩︎
[6] Michael Cembalest, JP Morgan – Eye on the Market ↩︎
[7] Michael Cembalest, JP Morgan – Eye on the Market ↩︎
DISCLOSURE
Past performance is no assurance of future results. Trademark Financial Management, LLC (“Trademark”) is a registered investment adviser with its principal place of business in the State of Minnesota. Trademark and its representatives are in compliance with registration requirements imposed upon investment advisers by those states in which Trademark operates. Trademark may only transact business in those states in which it is registered or qualifies for an exemption or exclusion from registration. This newsletter is limited to the dissemination of general information pertaining to its investment advisory/management services. Any subsequent, direct communication by Trademark with a prospective client shall be conducted by a representative that is either registered or qualifies for an exemption or exclusion from registration in the state where the prospective client resides. A complete list of all recommendations will be provided if requested for the preceding period of not less than one year. It should not be assumed that recommendations made in the future will be profitable or will equal the performance of the securities in this list. Opinions expressed are those of Trademark Financial Management and are subject to change, not guaranteed and should not be considered recommendations to buy or sell any security. For information pertaining to the registration status of Trademark please contact Trademark at (952) 358-3395 or refer to the Investment Adviser Public Disclosure web site (www.adviserinfo.sec.gov). For additional information about Trademark, including fees and services, send for our disclosure statement as set forth on Form ADV from us using the contact information herein or by calling 952-358-3395. Please read the disclosure statement carefully before you invest or send money. Any reference to a chart, graph, formula, or software as a source of analysis used by Trademark Financial Management staff is one of many factors used to make investment decisions for your portfolio. No one graph, chart, formula, or software can in and of itself be used to determine which securities to buy or sell, when to buy or sell them, or assist any person in making decisions as to which securities to buy or sell or when to buy or sell them. Any chart, graph, formula, or software used is limited by the data entered and the created parameters. The data was obtained from third parties deemed by the adviser to be reliable. Nonetheless, the adviser has not verified the results and cannot be assured of their accuracy.
Summary
U.S. stocks added another 2.6% last quarter, bringing its full year return to 17%.1 It was a rather subdued quarter compared to the previous three quarters, and once again international stocks performed substantially better. Investors felt a little more cautious about technology stocks last quarter as concerns grew as to whether the hundreds of billions being spent on artificial intelligence (AI) would have the kind of payoff that big tech stock prices implied. As the focus shifted to industries that would benefit from AI (versus those that were producing it), health care emerged as a winner. Utilities and real estate continued to struggle because both sectors are seen as beneficiaries of lower long-term interest rates. While the Federal Reserve cut short rates twice, this did not do much to lower mortgage rates2. Investors are trying to figure out the economy in which profits are rising quite nicely but this isn’t leading to more job creation.3
For several years we have been saying that international stocks are cheaper, but until this past year that really didn’t matter. For U.S. investors, the strength of the dollar tended to cancel out much of the gains foreign markets made in the local currency. Last year both factors needed to produce better foreign stock returns occurred; the dollar fell against most foreign currencies and local market stock performance was strong enough to close some of that huge fifteen-year performance gap. Overall, foreign stocks rose 3.8% last quarter and 33.1% for the full year.4 Brazil, South Korea, Taiwan, Germany and Canada all rose more than twice our 17% gain; India was the real laggard amongst major markets last year.
The U.S. stock market had a great run against foreign markets for dollar-based investors, but it looks like it may be over. Relative investment performance is a metric that tends to trend, and the trend appears to have reversed.
Bonds rose 1.2% during the quarter to end the year up 7.2%. This was the first year since 2020 that investors weren’t better off in short maturity bonds. There was optimism about long term rates coming down in September and October, but that had dissipated by December. The biggest profits on the bond side were in emerging market bonds, which rose about 3% last quarter and 14% for the year. Money market returns were over 4.2% last year, but their annualized rate slipped under 4% by the end of the year.
Commodities were the strongest area of the market last year, specifically the metals sector. Industrial metals rose 15.8% last quarter on increased demand for copper and aluminum for constructions. Precious metals rose 15.6% last quarter and 68% for the year due to unprecedented demand for both gold and silver, having mostly to do with global political instability. Crypto- currency had made some inroads in terms of replacing gold in recent years, but bitcoin’s small loss in 2025 showed that when you really need an alternative to the U.S dollar, only gold will do.
Activity
We reallocated portfolios in late September and October because we felt that the market had successfully navigated the seasonally weak late August through late September period without incident and would reward more aggressive positions to the end of the year. We did not get the kind of “Santa Claus rally” that you get in some years. Defensive industries (utilities, real estate) did underperform those that are more economically sensitive (industrials, transportation), with the exception of health care. We also worked hard from Thanksgiving to the end of the year to minimize capital gains. Since stocks rose by 17% and bonds increased by 7%, there simply weren’t enough losses to offset those gains, so we did our best with what was available. I guess lack of losses is a good problem to have. The other issue we encountered was the rapid increase in the price of gold. We established a 2% position in portfolios many years ago for those occasional periods of instability. It seemed like all of 2025 was a period of instability, and those 2% gold positions become 3-4%. We have been taking profits into strength, with our feeling now that gold should not exceed 3% to 3.5%. At some point that degree of volatility can work against you.
Outlook
Any advisor will tell you that there is never any shortage of opinions about where the market is headed. At the beginning of any year, every major investment firm has a webinar in which they give you their prediction for the year. If they are a product shop (i.e. they sell investments), the predictions will almost certainly be bullish on both stocks and bonds. On the other hand, if they sell research or analytics, they are often overly pessimistic because they feel that negativity makes them seem smarter. We are making no prediction about investment returns this year because we just see too many wild cards out there. Not least of these is the geopolitical and economic objectives of the United States, which seem to change on a weekly basis.
Aside from that, AI spending and future revenues are the biggest unknowns in the market right now. AI is already being used widely in industry to boost productivity, but there is no “killer app” yet. Access to AI at this point is free for writing and editing purposes and is available at a reasonable subscription price for larger entities. That said, it has not reached the “I’ve got to have it whatever it costs” stage that binds you to it and gives providers a large, growing, and reliable income stream.5 This could be a problem because many technology and related stocks are priced on the assumption that the high margin application stage will be reached. Even if AI becomes essential, it’s uncertain whether we could produce enough electricity to power all of the things we expect it to do. So, in a sense we are building the proverbial bridge as we are crossing it.
If this chart is true, then the big technology hyper-scalers will be spending so much money building out their AI programs that they won’t be able to afford much in the way of dividend increases or share buybacks. Stock prices have already begun to reflect concern.
On the positive side, some parts of the market (small caps, emerging markets) that haven’t moved much over the past ten years (and are therefore reasonably priced) have been doing well lately. If there is widespread disappointment with technology profitability, money will probably rotate into other sectors as long as the general economy holds up. Interest rates are the key. If the ten-year note can stay around 4%, we’ll probably be okay this year.
Commentary – Random Thoughts
In the absence of one unifying theme for this commentary, I’d like to present a few quotes and ideas and charts that have interested me lately.
Michael Cembalest is an investment strategist for J.P. Morgan whose research and ideas are “must reading” among financial professional these days. A lot of what I know about the opportunities and challenges of AI are from his writings. There are two things he has written recently that I have noted:
1. “US technology price-to-earnings-growth ratios are only 1-3 times in recent years. In the dot.com era stock prices were 4-8 times expected annual earnings growth”.6 In other words, we have not maxed out at all what investors might pay at the top of the cycle.
2. “After a correction, ask “what could go right” rather than obsessing over factors that led to the selloff. And when markets are highly concentrated and near all-time highs, the right question to ask is “what could go wrong”.7 He is saying that there aren’t enough people thinking today about what might go wrong because every sell-off since 2011 has been an opportunity to buy. At some point, the market will cry wolf and there really will be a wolf.
Margin Debt is a measure of how aggressive (leveraged) stock market investors are in aggregate. As you can see, we are at all-time highs. This doesn’t mean we can’t go higher, but it does suggest that the current advance is pretty far extended. When this measure starts to fall, often a recession is not far behind.
One of the reasons for the big surge in gold prices is the surge is buying by foreign central banks. Why have they been buying gold and selling their U.S. Treasuries? Every country has its own reasons, but China has been trying to diversify away from the dollar since the mid-2010s when the trade war with the U.S. intensified. The sharp move in recent years has to do with widespread fears that the U.S. might seek to punish any country that did not fall in line behind it, much as it punished Russia economically after the Ukraine invasion and Iran before that.
The economy was not as strong last year as it appeared. Largely, GDP rose because we spent more for health insurance.
Diclosure
Past performance is no assurance of future results. Trademark Financial Management, LLC (“Trademark”) is a registered investment adviser with its principal place of business in the State of Minnesota. Trademark and its representatives are in compliance with registration requirements imposed upon investment advisers by those states in which Trademark operates. Trademark may only transact business in those states in which it is registered or qualifies for an exemption or exclusion from registration. This newsletter is limited to the dissemination of general information pertaining to its investment advisory/management services. Any subsequent, direct communication by Trademark with a prospective client shall be conducted by a representative that is either registered or qualifies for an exemption or exclusion from registration in the state where the prospective client resides. A complete list of all recommendations will be provided if requested for the preceding period of not less than one year. It should not be assumed that recommendations made in the future will be profitable or will equal the performance of the securities in this list. Opinions expressed are those of Trademark Financial Management and are subject to change, not guaranteed and should not be considered recommendations to buy or sell any security. For information pertaining to the registration status of Trademark please contact Trademark at (952) 358-3395 or refer to the Investment Adviser Public Disclosure web site (www.adviserinfo.sec.gov).
For additional information about Trademark, including fees and services, send for our disclosure statement as set forth on Form ADV from us using the contact information herein or by calling 952-358-3395. Please read the disclosure statement carefully before you invest or send money. Any reference to a chart, graph, formula, or software as a source of analysis used by Trademark Financial Management staff is one of many factors used to make investment decisions for your portfolio. No one graph, chart, formula, or software can in and of itself be used to determine which securities to buy or sell, when to buy or sell them, or assist any person in making decisions as to which securities to buy or sell or when to buy or sell them. Any chart, graph, formula, or software used is limited by the data entered and the created parameters. The data was obtained from third parties deemed by the adviser to be reliable. Nonetheless, the adviser has not verified the results and cannot be assured of their accuracy.
[2] Because mortgages tend to be tied to it, the ten-year U.S. Treasury is seen as the key to the housing sector. ↩︎
[3] Except in health care, but those are primarily lower wage jobs tied to taking care of senior citizens. ↩︎
[4] JPMorgan Asset Management, Guide to the Market 1Q26. In U.S. dollar terms. ↩︎
[5] Like the iPhone, for instance, or Google. You could use a different phone or search engine, but the network effects of both of these was overwhelmingly powerful. ↩︎
[6] Michael Cembalest, JP Morgan – Eye on the Market ↩︎
[7] Michael Cembalest, JP Morgan – Eye on the Market ↩︎
Summary
The stock market rally continued, with the S&P 500 adding another 8.1% last quarter to bring its year-to-date gain up to 14.8%. Once again, technology was the leader, as its 13.2% quarterly gain was driven by sky-high aspirations for growth in the artificial intelligence trade(AI) sector. The only declining sector was consumer staples (think Pepsi and Procter & Gamble), which posted a -2.4% loss. The AI boom is mainly lifting technology stocks (especially those that produce the semiconductor chips that power the search for greater intelligence), but it’s also the boosting the utility stocks that provide the power, the real estate stocks that provide the land where data centers are built, the industrial stocks that build the plants and cool them so they don’t overheat, and the financial stocks that raise the money for all of this. There is a certain gold rush mentality in the stock market right now, which is exciting but also increasingly concerning.
Emerging markets outpaced both U.S. stocks and foreign developed markets stocks last quarter. China was especially strong as its government provided significant support to its technology sector. Knowing that cutting-edge semiconductor chips from Nvidia would no longer be available because of trade restrictions, China has gone “all-in” on producing its own. Many of the best performing foreign markets this year have been in the emerging area – Vietnam, South Korea, Poland, and Peru – are each up more than 50%. That’s why you diversify.
Bonds added another two percent last quarter, bringing their year-to-date return to 6.1%. When interest rates started to soar in early 2022, investors found that they were better off in money market funds than in bond funds because the latter was more volatile yet returned less because of inflation. That hasn’t really been the case over the last 12 months; the promise of interest rate cuts has invigorated the bond market as money market yields have fallen. High-yield bonds have risen 7.2% this year, nicer than Treasuries, but maybe not enough extra yield for the added risk. So far this year, global bonds have continued to be the top performers. Emerging market debt rose another 4.3% last quarter and is up close to 11% year-to-date. Municipal bonds have been the weakest sector of the bond market this year, but they finally began to perform in August and finished the quarter up 3.1%.
All the above paled in comparison to the stellar gains from the gold sector. Gold bullion soared 16.4% last quarter due to several factors, including global central bank demand and fears about U.S. interest rates and trade policy. Gold mining stocks, which can be considered leveraged investments tied to gold price movements, experienced a 43.8% increase in the last quarter. Gold is a very volatile sector, so it is essential to make changes incrementally.
Activity
Risk-taking was clearly in fashion last quarter as stocks in select niches like quantum computing, uranium mining, and cryptocurrency staking made large moves. There isn’t much one can do in an environment like this – we are not going to chase stocks in companies that are just starting up and hardly even have revenues (let alone profits). We were more interested in weeding out some underperformers (stock funds that leaned too heavily into real estate, health care, energy, or consumer staples) than making any major changes. Sometimes it pays to buy what is cheap and out of favor, but this past quarter was not such a time. On the bond side, in addition to extending the duration to benefit from declining interest rates, we also reduced floating rate exposure because lower rates mean lower yields.
Outlook
Historically, September is a difficult month for stocks. Market started to anticipate this by flattening out in mid-August, but positive interest rate news sent the market soaring again after Labor Day. I have learned over decades in this business to be nervous when investors get this ebullient, but I know I’m never get the exact timing of a market top. If one leaves the party too early, one can miss a lot. The S&P 500 has provided outstanding returns since 2012, so if one is going to go against the big technology names that lead this index, one better be very sure of both their thesis and their timing (and I am not). I just know that trees don’t grow to the sky. A couple of charts of hot sub-sectors show just how far and how fast we’ve run up:
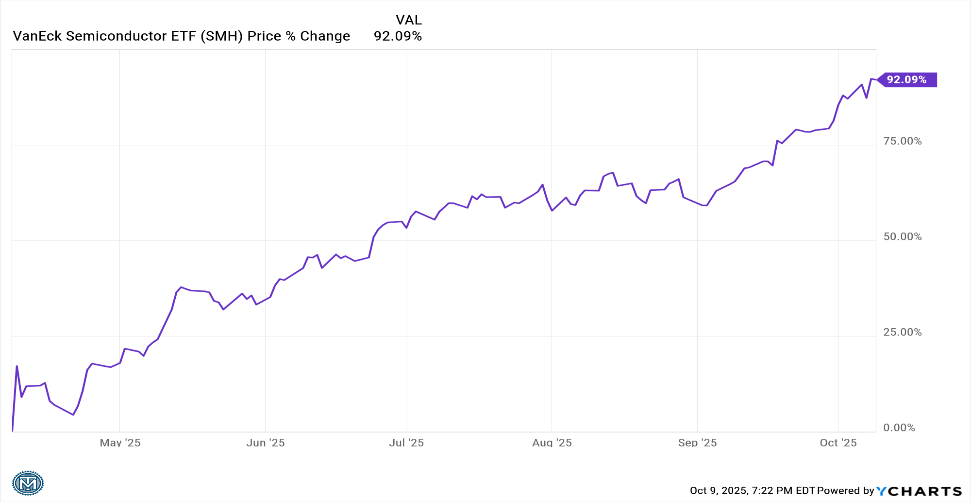
Semiconductors are up over 92% since April 8th. They are a key component in Artificial Intelligence, but still… 92% in six months?
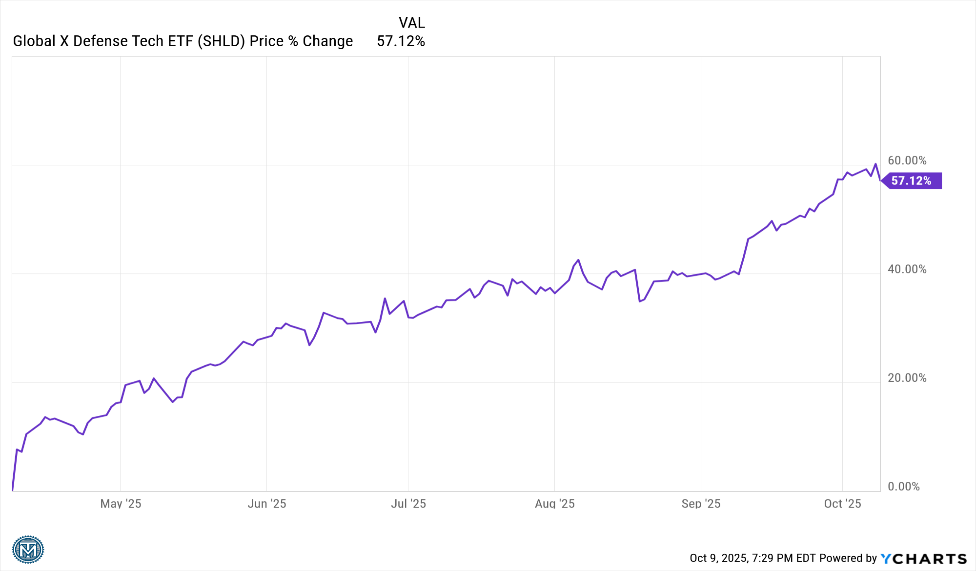
This is the defense technology sector. Up 57% in six months. The charts for gold, coal, copper, uranium, quantum computing, and digital finance and just as strong (if not stronger).
I am not averse to investing in these sectors (we already do, to some extent). In fact, I believe that the two interest rate cuts we expect this year meaningfully reduces the chance that the “tech reckoning” happens in 2025. If this sounds too bearish, remember this: the bursting of the technology bubble in 2000 led to a half-decade of great returns for the small company and financial/real estate sectors because the fallout led to sharp decline in interest rates. I’m starting to become bullish about non-technology sectors. When it comes to the financial markets, someone’s pain is often somebody else’s gain.
Commentary
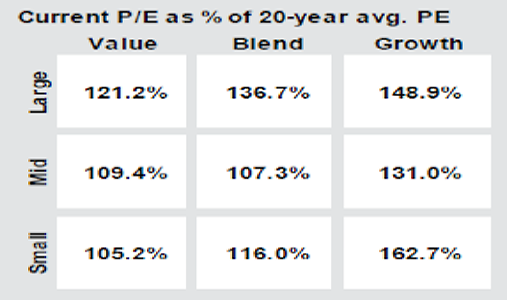
Since I’ve suggested that technology may not be a leading sector going forward, I owe you a good discussion of why I feel this way. You will recall that last quarter when I described the dramatic outperformance of growth over value in recent years I did not suggest that I saw an imminent end to that.1 The stock market can and often does remain overvalued for prolonged periods of time if liquidity conditions are favorable. If investors don’t get carried away, nice gains can be had for years. However, as happens every so often, investors decided they wanted to discount future earnings all at once. Several years of anticipated AI profits in different areas of the economy were priced in. This is making it exceedingly difficult to justify what is going on without making comparisons to earlier pre-crash periods like 1987 or 1999 or 2021.
Here are my main areas of concern:
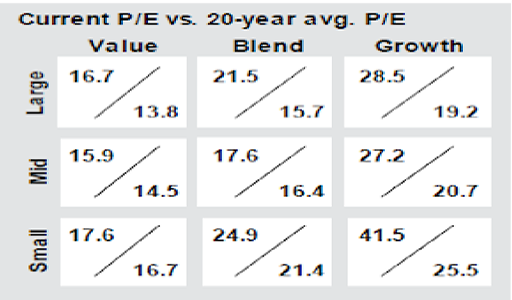
1. Valuation – A Nice Increase in Earnings Growth Has Gone a Long Way
This chart shows how the market is turning modest corporate profit increases into large price gains.
2. Relative Strength – Piling Into Today’s Winners Can Be a Risky Strategy
Relative strength is a measure of how strong the price performance of an asset is versus its peers. Theoretically, one wants to own assets that are over-performing and to avoid those that are under-performing. At a certain level of over- or under-performance, however, the trend is usually unsustainable; nothing soars or plunges forever. The market uses a measure called RSI to determine good over-performance (recognition of competitive advantage) versus dangerous over-performance (assertions that said company “owns the future”). An RSI over 75 suggests the stock or ETF is doing so much better than the overall market that a period of “consolidation” – at the very least – is likely. Wall Street has a maxim: “Pigs get fat, hogs get slaughtered” to warn against feeding too heavily at the trough, so to speak.
3. Increasingly Lower Free Cash Flow – Not All Great Businesses Today Will Be Great Businesses Tomorrow
Investors typically love free cash flow, which is defined as the cash a business has left over after all expenses (including taxes and dividends) are paid, PLUS any spending required to maintain the current level of profitability (in other words, depreciation). The more the hyper-scalers (Meta, Amazon, Microsoft, and Alphabet) are forced to spend just to keep pace in the AI race with their rivals, the less they have for dividends, stock buybacks, or acquisitions.
One of the biggest attractions these stocks had up until recently was that they were huge free cash generators. As such, they commanded price-to-earnings multiples of over 30 times (while for the average stock, the P/E multiple is less than 20). If they continue to have to spend gigantic sums on their AI buildouts, they deserve lower P/E multiples.2 This implies that their current stock prices are too high.
4. Quality – Lower Quality Companies Tend to Outperform Before Market Peaks
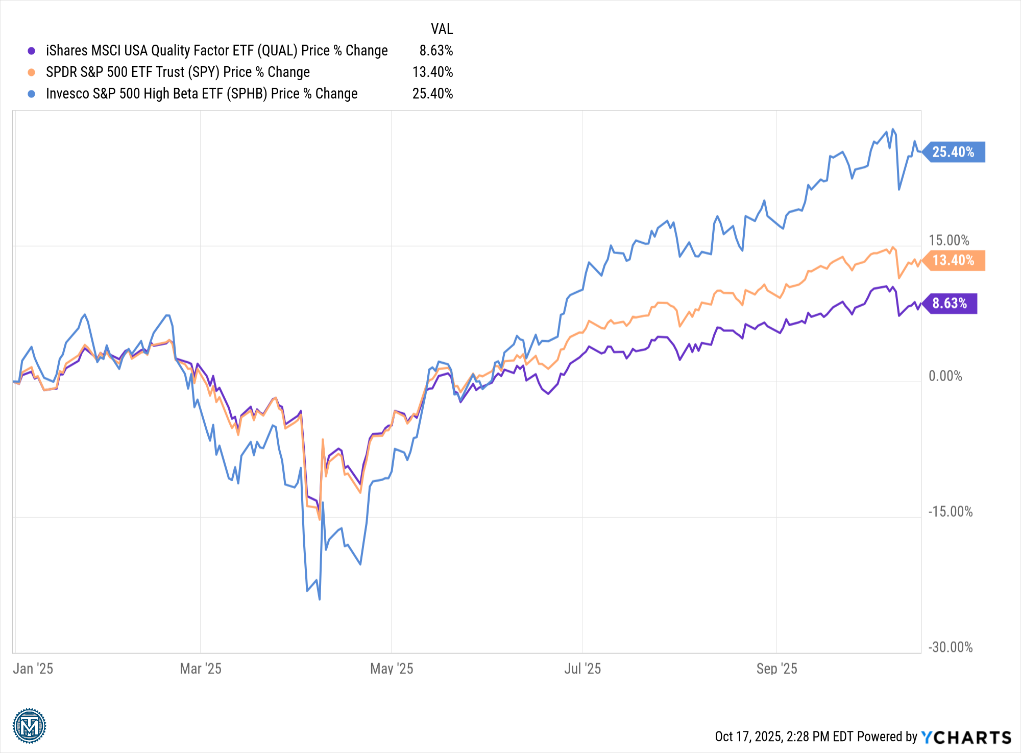
Quality, as a stock attribute, sounds like something you definitely want. It is usually defined as having a strong balance sheet, strong cash flow, and a leading position in a growing industry. Many believe that companies exhibiting these characteristics have better stock performance over time, and they are generally correct. That said, “quality” historically delivers its best performance during downturns (when poorly financed companies with declining cash flows tend to decline much, much more). While no investment manager ever says that they focus on low-quality companies, the fact is that those companies tend to perform better when speculative fever is high. Some of the biggest winners this year are either highly leveraged or very vulnerable to disruption. This has been especially true since June:
The S&P 500 is the orange (middle) line. If you extract just the riskiest companies (blue line) from that index, you earn a much better return. If you factor out the highest quality companies, you would be under-performing
5. Profit Taking Sounds Good, Realization of Taxable Gains Does Not
One of the things that made the bursting of the dot com bubble from 2000-02 so painful was that investors saw their tech portfolios lose 60-85% of their value, AND they had to pay capital gains taxes! Understandably, investors prefer to avoid taxes, so they are disinclined to sell positions that have appreciated significantly in value. What tends to happen, therefore, is that when stock prices begin to fall, investors tend to sell those positions with just modest gains and hold the ones with larger gains. This is called “profit taking”, and it is quite common. However, every decade or two, there is a significant sell-off where investors start to panic and sell more indiscriminately. The big winners tend to become big losers because those stocks and funds that didn’t see much profit-taking in the up years begin to “catch up” on the downside. These stocks have a significantly greater amount of embedded capital gains, so even down 50% or more the tax hit can be very large.
Again, all of this is offered not because I expect the tech sector to go down substantially very soon, but because I know some sort of re-adjustment is almost sure to happen and it might happen soon. We hear a lot about AI these days, but one should understand that large future sales of power, data centers, and semiconductor chips are already priced into most stocks. The kinds of things that I look for to tell me that risks are elevated – high valuations, narrowing market breadth, decreasing free cash flow, low quality leadership – are considerably more prevalent in the technology sector now than they were three months ago, which increases my nervousness. With liquidity conditions positive and interest rates set to be cut twice more this year, I think the odds of something major happing in 2025 aren’t high. I am, however, looking harder than I have in years at finding areas outside of the AI trade to shift assets to.
[2] Additionally, the new budget law recently enacted by Congress (OBBBA) allows a much slower depreciation schedule (6 years instead of 3. This change has given these firms a reported earnings benefit of 7-12% in 2025, according to TenViz. Since the actual chip and server technologies are becoming obsolete faster rather than slower, arguably depreciation schedules should have shortened rather than lengthened. ↩︎
DISCLOSURE
Past performance is no assurance of future results. Trademark Financial Management, LLC (“Trademark”) is a registered investment adviser with its principal place of business in the State of Minnesota. Trademark and its representatives are in compliance with registration requirements imposed upon investment advisers by those states in which Trademark operates. Trademark may only transact business in those states in which it is registered or qualifies for an exemption or exclusion from registration. This newsletter is limited to the dissemination of general information pertaining to its investment advisory/management services. Any subsequent, direct communication by Trademark with a prospective client shall be conducted by a representative that is either registered or qualifies for an exemption or exclusion from registration in the state where the prospective client resides. A complete list of all recommendations will be provided if requested for the preceding period of not less than one year. It should not be assumed that recommendations made in the future will be profitable or will equal the performance of the securities in this list. Opinions expressed are those of Trademark Financial Management and are subject to change, not guaranteed and should not be considered recommendations to buy or sell any security. For information pertaining to the registration status of Trademark please contact Trademark at (952) 358-3395 or refer to the Investment Adviser Public Disclosure web site (www.adviserinfo.sec.gov).
For additional information about Trademark, including fees and services, send for our disclosure statement as set forth on Form ADV from us using the contact information herein or by calling 952-358-3395. Please read the disclosure statement carefully before you invest or send money. Any reference to a chart, graph, formula, or software as a source of analysis used by Trademark Financial Management staff is one of many factors used to make investment decisions for your portfolio. No one graph, chart, formula, or software can in and of itself be used to determine which securities to buy or sell, when to buy or sell them, or assist any person in making decisions as to which securities to buy or sell or when to buy or sell them. Any chart, graph, formula, or software used is limited by the data entered and the created parameters. The data was obtained from third parties deemed by the adviser to be reliable. Nonetheless, the adviser has not verified the results and cannot be assured of their accuracy.
Quarterly Market Summary
Summary
What a turnaround! Stocks soared to a 10.9% quarterly return last quarter after President Trump reversed himself on tariffs. The “Liberation Day” tariff announcement on April 2nd caused a further 12% one-week sell-off after stocks had already fallen 8% from their February 19th highs. Investor sentiment was grim. Then, on April 9th, tariffs on foreign-made goods were largely rescinded for the time being. Stocks rose over 8% that day. Gradually, investors began to believe that their fears about inflation and recession might be overblown. They reasoned that if the administration was simply employing an aggressive negotiating tactic and never really planned on going through with tariffs of 50% and higher, maybe they aren’t as reckless as first thought. The rally really got going after Microsoft’s surprising large earnings beat on April 30th and semiconductor giant Nvidia’s assurance in May that the AI race was just getting started.
As a result, technology was the big sector winner last quarter with a 22.9% gain, but industrials also gained over 12%. Defensive industries like consumer staples (no growth), health care (RFK Jr., Medicaid cuts), and energy[1] lagged badly. U.S stocks are up 6.2% through June 30th.
Foreign stocks have done much better. In local currencies, world stocks rose 8.3% in the first half of the year. Because the U.S. dollar fell sharply as global investors shifted assets out of U.S. markets, dollar-based investors earned nearly 11% more by investing overseas. This finally provided some validation for proponents of international diversification after years of under-performance due to a strong dollar and a less advantageous industry mix[2]. Asian stocks gained the most last quarter led by China. Lessening of trade frictions were good for everybody, but the U.S. and China benefitted the most.
Bonds gained 1.2% last quarter. This is big “cool down” after a strong (2.8%) first quarter. Yields have steadied in a narrow range as investors weigh where inflation and tariff policy are going next. Non-US debt continued to benefit from a weaker dollar. Private credit and mortgage bonds also outperformed. Municipal bonds were once again the worst bond sector. They have become very cheap now, and many bond market experts are saying that this is the time to buy.
Alternative assets such as gold and bitcoin have been choppy, but both have had multiple surges to new highs this year.
Activity
The second quarter came in like a shark and went out like a kitten. The first six trading days of the quarter were wracked with tariff fears and selling, then we got the policy reversal, and then investors increasingly traded stable assets for those that had more upside potential. The key consideration for performance was how strongly one altered their positioning in March in anticipation of tariffs and how quickly one reversed those changes in April or May once the tariff scenario changed. We made moderate risk-off moves in March. By early May we had repositioned portfolios back toward risk assets, but not quite as much as if the whole thing hadn’t happened in the first place. Policy volatility continues to make this an exceptionally challenging (but not necessarily bad!) time to invest.
Outlook
Investors have learned, over the past fifteen years, that if you get a meaningful dip in stock prices you better be a buyer. The vehemence with which bearishness switched to bullishness has reinforced the notion that selling is dangerous – you are probably going to have to buy back whatever you sell, and the price may well be higher then. There are some large tariffs set to take place early next month which if implemented would likely cause stocks here and overseas to fall, but as I write this on July 17, 2025 – the stock market isn’t putting much stock into those concerns. Nobody wants to be the guy who sold out and now has egg on his face because the tariffs were just a bluff and never went into force. In essence the market is playing a giant game of chicken, so to speak. I hope it doesn’t have to blink this time.
Commentary – Warren Buffett and Michael Saylor
This seems like an appropriate time to appreciate the career of Warren Buffett, the chairman of Berkshire Hathaway and perhaps the most famous and successful investor of the past 75 years. Mr. Buffett announced in May at the annual shareholders’ meeting that he was turning the chief executive officer role over to a successor. The 94-year-old Buffett is probably most well-known for his stellar long-term returns, but to professionals his standout quality was his patience. His best returns often came from stocks that had their best years long after Berkshire first purchased them. Mr. Buffett exploited a huge behavioral weakness that investors have – the inability to accurately assess opportunities and risks that would take years instead or months to play out. Time after time he would buy stakes in strong companies that were facing a near-term challenge, then hold them while the challenge was overcome and the stock returned to its upward trajectory. A less appreciated but also important behavioral skill he possessed was the ability to avoid being drawn in by short-term market fads. He would rather let cash accumulate on Berkshire’s balance sheet than overpay for a company just because it was doing well. If you are patient, he argued, you do not have to pay top dollars for the best companies. Eventually, they will come to you. For example, he earned tens of billions of dollars for Berkshire by buying Apple stock during slumps in 2013 and 2016[1].
Warren Buffett’s approach is known as value investing, and it was the model for investing in the 20th Century. It was taught and is still taught in business schools and in the CFA program. But value investing is not the way that most investing is done today. Michael Saylor is the Executive Chairman of a company called MicroStrategy (now just Strategy), and he is a pretty good example the modern investment approach. Strategy borrows money in the bond market and uses the proceeds from its borrowing to buy bitcoins. This works because investors currently value Strategy at roughly twice the value of the bitcoins it holds. Why? Because there are many things you can do with bitcoins (including lending it to speculators for a tidy fee) and because the Trump Administration is very crypto-friendly and is likely to approve even more uses for bitcoin. Since bitcoin was invented back in 2008 it has both risen tenfold and lost two-thirds of its value several times. If Buffett’s edge is patience, Saylor’s edge is fortitude. He can psychologically withstand brutal downturns that the vast majority of investors cannot.
I bring up this comparison not because either Buffett or Saylor is a good or smart person or has the better approach but because I believe both are a product of their times. Warren Buffett was born during the Great Depression. He saw both a World War and decade long periods of time where stocks made investors less than nothing after inflation. He was influenced by Benjamin Graham’s idea of “Margin of Safety” which is decidedly a “First Principle – Don’t lose money” kind of philosophy. On the other hand, Michael Saylor started MicroStrategy in 1989. His investment career coincided with relative political stability and huge gains in the market punctuated by brief downturns in 2000-02, 2007-09, and even shorter ones in 2020 and 2022. He is a very successful investor during a climate where no matter how far asset prices fell, they always came roaring back in fairly short order. Those who picked the right asset (Apple, Nvidia, bitcoin) and went “pedal to the metal” made the most money – if they didn’t lose their nerve. Such is growth investing, and its superiority this century has been amazing.
Maybe this is how the rest of the decade will go. Maybe this is how the entire twenty-first century will go. All I can say is that I can’t believe that it will, and I cannot professionally or personally invest as if I think it will. As a student of market history (going back two centuries), I have recognized a pattern of increasingly speculative excess leading ultimately to very deep busts. The success of Strategy by itself doesn’t say anything about whether or not this is the pre-bust part of a great market cycle. Saylor may just be one of those investment geniuses that arise during both good periods and bad. But coupled with the rise in ways to outright gamble on the market, especially the explosion in options and other forms of leverage and online trading forums, I am convinced that this is one of those speculative eras that will not end well.
That said, I also know that it is beyond my ability to predict when this will happen, so getting super defensive and waiting is just not an option. I know people who have tried that.
Investing always involves risk, but today it involves more risk than usual. Not just because prices are high historically[i], but because there is a similar embrace of risk-taking and risk-takers that I’ve read about in the late 1800s and the 1920s and I lived through in the late 1990s. Moreover, this higher risk behavior is taking place at the same time as America’s policy framework is undergoing significant changes not seen since the 1930s, and at a time where corporate America is betting VERY BIG on artificial intelligence. Those are important topics whose implications I’d like to address in future Commentaries, but don’t have enough room left in this one.
So, in conclusion I’d like to thank Warren Buffett for his contributions to the field of investment analysis and management as well as to the pocketbooks of all of us who have invested over the last forty or so years. I’d also like to thank growth investors like Michael Saylor who remind investors more psychologically sympathetic to value strategies, like myself, that growth tends to perform a lot better than value when the financial and geo-political winds are at your back. I hope that this continues to be the case.
DISCLOSURE
Past performance is no assurance of future results. Trademark Financial Management, LLC (“Trademark”) is a registered investment adviser with its principal place of business in the State of Minnesota. Trademark and its representatives are in compliance with registration requirements imposed upon investment advisers by those states in which Trademark operates. Trademark may only transact business in those states in which it is registered or qualifies for an exemption or exclusion from registration. This newsletter is limited to the dissemination of general information pertaining to its investment advisory/management services. Any subsequent, direct communication by Trademark with a prospective client shall be conducted by a representative that is either registered or qualifies for an exemption or exclusion from registration in the state where the prospective client resides. A complete list of all recommendations will be provided if requested for the preceding period of not less than one year. It should not be assumed that recommendations made in the future will be profitable or will equal the performance of the securities in this list. Opinions expressed are those of Trademark Financial Management and are subject to change, not guaranteed and should not be considered recommendations to buy or sell any security. For information pertaining to the registration status of Trademark please contact Trademark at (952) 358-3395 or refer to the Investment Adviser Public Disclosure web site (www.adviserinfo.sec.gov). For additional information about Trademark, including fees and services, send for our disclosure statement as set forth on Form ADV from us using the contact information herein or by calling 952-358-3395. Please read the disclosure statement carefully before you invest or send money. Any reference to a chart, graph, formula, or software as a source of analysis used by Trademark Financial Management staff is one of many factors used to make investment decisions for your portfolio. No one graph, chart, formula, or software can in and of itself be used to determine which securities to buy or sell, when to buy or sell them, or assist any person in making decisions as to which securities to buy or sell or when to buy or sell them. Any chart, graph, formula, or software used is limited by the data entered and the created parameters. The data was obtained from third parties deemed by the adviser to be reliable. Nonetheless, the adviser has not verified the results and cannot be assured of their accuracy
[1] He was a heavy seller in 2024 at prices 6-9 times higher.
[i] Stock are statistically expensive, but that has been the case for most of the last forty years, so this fact has almost no predictive value.
[1] Energy investors always assumed that a war in the Middle East would send oil prices soaring. When the war came and went and prices were only briefly affected, the “conflict premium” declined considerably.
[2] Far more of the U.S. market is in technology, the best performing sector of the last fifteen year, than foreign markets contain.
Summary
The first quarter of 2025 started off well enough, but it deteriorated badly as the quarter came to an end. Between Election Day and Inauguration Day, the market had a lot of optimism about the new administration’s plan to aid “re-shoring” (bringing overseas manufacturing back to America). President Trump during his first term paid careful attention to how the stock market interpreted his policies, so investors naturally assumed that he would be sensitive to stock prices this time as well. So far, they have been disappointed. The stock market peaked in mid-February and has moved sharply lower ever since. Trump threatened our trading partners with large tariffs and then, despite the market’s negative reaction, followed through with them. What really roiled the markets was that the actual tariff rates proposed were both larger than expected and seemingly without any evidence of a thought-out methodology. Global financial markets – stock, bond, and currency – have reflected a movement away from the U.S. ever since[i]. US. stocks fell -4.6% during the first quarter[1]. Technology, retailing, and small cap stocks lost the most.
International stocks performed very well early on in the quarter and despite the tariff crisis still ended it with modest gains. The developed market index (MSCI EAFE) gained 7.0% and the emerging market index (MSCI EM) rose 2.9%. To some extent, foreign markets have been the beneficiaries of America’s more adversarial stance. The U.S. prospered over the years from foreign investors parking their money in our stock and bond markets. Now, having some concerns about our policies, many foreign investors are reducing their exposure here. All in all, the value of diversification really proved itself last quarter as foreign stock and bond gains somewhat offset the drag from falling U.S stocks.
U.S. bonds had a pretty decent quarter, rising 2.8% according to Bloomberg. That said, they have become increasingly volatile in recent weeks as investors try to figure out what effect tariffs will have on inflation, interest rates, our trade deficit, and the value of the dollar. After several years of outperforming government bonds, corporate bonds underperformed them in the first quarter as economic fears increased. On the other hand, after over a decade of dismally underperforming dollar-based bonds, foreign bonds had an excellent quarter. The weak dollar has really shaken things up. Perhaps the biggest beneficiary of the weak dollar and doubt over U.S. policy has been gold, because investors always need a safe-haven asset, and it doesn’t seem to be U.S. T-Bills anymore. Gold rose close to 20% during the first quarter.
Activity
The first quarter was a wild ride, especially at the end. Headlines were changing every day, many having a big impact on asset prices. Early in the quarter the market priced in de-regulation, which means faster growth but higher interest rates. That favors growth and cyclical stocks and higher-yielding bonds. As it began to be clear that the agenda for Trump’s second term was going to be a lot different than that of the first term, markets had to make some big shifts. Economic policy was not going to be conducted on the basis of whether or not the financial markets favored it; instead it was going to be more populist. That said, there was no real playbook for how to model the inflationary or deflationary impact of a trade policy in which tariff rates seemed to change daily. What we did know, however, was that the way the markets had initially positioned for a second Trump term was turning out to be completely wrong. We had to pivot toward more defensive stocks, higher quality bonds, and portfolio protection in the form of gold and other alternatives that are not as sensitive to the economy. We also needed to raise cash levels. We are still making adjustments. One notable change is that due to volatility, new funds are invested more gradually – in order to avoid buying too much on what might turn out to be an inauspicious day.
Outlook
Expect volatility. President Trump’s goal seems to be to keep everyone off balance, and he is meeting that goal so far. George H.W. Bush did not want to raise taxes in 1990, but a sharp rise in the deficit pushed the dollar down and interest rates up and forced his hand. Bill Clinton wanted to make major changes to health care and social programs in 1994, but the bond market was not having it, so he had to abandon most of his plans[2]. Sometimes markets don’t let a president do what he would like to. Usually, it doesn’t go well for the economy when presidents try to ignore markets. I believe there is room for a stock rally if this president moderates his agenda, but right now he doesn’t seem anxious to do that. Markets aren’t waiting – investors are “voting” for change by replacing the dollar with gold and the Japanese Yen, and they are trimming their stock and longer-term bond positions.
Commentary – Of Pianos, Mattresses, and Light Switches – Why it is Especially Challenging to Manage Assets in this Environment
I believe that the Trump Administration believes that the trade deficit that America has had for decades is a result of other countries taking advantage of America’s generosity, and that it isn’t fair. I believe that America consciously and purposefully ran a trade deficit. We were buying influence and giving the world an incentive to choose capitalism over Soviet or Chinese-style command economies. I believe that this influence came in handy for America after September 11th, when the U.S. called in favors and nearly everyone responded (even those that had misgivings). That said, capitalism has certainly won the economic war and revisiting our global commitments might have been in order. In his first term, President Trump complained that most European nations were not living up to their agreed-to defense financial obligations. Despite this, not much changed. Europeans knew they were not spending enough, but they also understood that they were also helping America to project its power more easily into the Middle East and Asia.
This is the political backdrop for what has occurred in the financial space since Trump has come back into the Presidency. The United States had a legitimate gripe, but is it pursuing that gripe constructively or destructively? Did it consider all the implications of blowing up the status quo? The Trump Administration resented tariffs placed on American goods as well as the non-tariff barriers many countries imposed. However, like its non-nuanced view of global geo-politics, it also had a narrow economic view. The United States of America in the 2020s is very largely a service economy. It runs a trade surplus in services with almost every country on Earth. In addition, the U.S. has its own tariffs and non-tariff barriers. This is why trade disputes are typically negotiated. It was thought to be understood that nobody really benefits from blowing up the whole framework of international trade.
The global economy is exceedingly complicated. It is very arduous and time consuming to try to change, which is why there are typically a lot of negotiations. One option Trump had was to treat the process of restructuring trade and political relationships like moving a Steinway grand piano out of a third floor studio – carefully, and with a lot of people and ropes and things. Another option was to treat it like getting rid of an old mattress – open the window and toss it out. Evidently, he is choosing the latter. Global investors have been trying to cope with this ever since.
Truthfully, we don’t know whether this bold experiment will ultimately prove to be successful, or modestly successful, or mostly unsuccessful, or disastrous. It is too soon to tell. That said, markets are always trying to anticipate future results. It would have been possible to announce the tariffs on April 2nd with a meticulous explanation as to why each country was assessed the amount it was. When that didn’t happen, markets made a downward revision to anticipated future returns. Two days later, the administration revealed a mathematical formula (with Greek letters!) to justify how much each country was tariffed. Unfortunately for them, most economists can do math with Greek letters, and they were not impressed. Side note – one can write a formula using Greek letters to explain the basic premise of American football (you need to advance the ball at least ten yards every four plays), but that doesn’t make it especially complicated. So the reveal, which was basically that we tariffed each country roughly by the percentage of our trade deficit with them, blew a hole through America’s credibility and made markets go down even more. When the 90-day reprieve was announced on April 9th, markets rejoiced to the tune of nine percent in less than three hours, but that still left us considerably short of where we began, and we still have the tariff deadline looming ahead.
All of this makes portfolio management very challenging. Typically, when an investment analyst makes a forecast, he or she is trying to assess how fast the economy is going to grow, to what extent interest rates are going to rise or fall, and most importantly what the interplay will be between the economy and interest rates. Think about this as being like a dimmer switch in your dining room – based on new input one nudges one’s expectations up or down a bit. If necessary, you have to replace a less suitable asset with a more suitable one. Now think about how tariffs impact a forecast. A 5% tariff increase affects a company’s profit margins; maybe they pass it on to their customers, maybe they have to absorb it themselves, but they want to keep the business so they pay it. A 25% tariff, on the other hand, is probably too large to absorb. If they can’t pass most of it on, they have to consider foregoing the import and telling their customer to get it from somebody else. Recently, the Trump Administration and China have raised tariffs on each other to over 100%. That is a “FORGET IT” level. Nothing (except tiny components) gets bought or sold at that tariff level. Economies start to go south very fast when trade grinds to a halt. That’s not a dimmer – that is an off switch! A portfolio in a “dark” room is going to have to be a great deal different (more conservative) than a portfolio in a lighted room.
Obviously, the value of any income stream changes dramatically when its tariff rate changes from 40% to 10%, as happened on Wednesday April 9th. There was an intraday rally of almost 9%. It is very hard to model for something like that. How does an investor respond to this kind of volatility? If you are an investor not domiciled in the United States, you can’t possibly anticipate what the U.S. President might say or do next, so you protect yourself by selling dollar-based assets. You reduce exposure to the “suddenly-not-so-safe” haven of U.S. bonds and stocks and increase your weighting of alternative safe havens like gold (up 26.5% year-to-date) or the Japanese yen (+10.5%). This is what we have seen lately.
For the last decade or so prominent investors have used metaphors like “cleanest dirty shirt”[3] to illustrate the point that however concerned one might be about America that every other country as an investment option was considerably worse. American asset outperformance became so taken for granted in recent years that “American exceptionalism”[4] was widely used in investment circles. These notions are being called into question now. Again, I don’t know how this is all going to be resolved, but I do know that I can’t put the same valuations on U.S. assets that I did in the “TINA” (There Is No Alternative) Era. U.S. assets will necessarily carry lower premiums over foreign assets than they did from 2012 to 2024. It doesn’t mean they won’t produce nice gains, but as a whole they should underperform non-US bonds and stocks. Alternatives like gold and commodities are going to have to be a larger part of portfolios as well.
In all probability, the world has now entered a new era. The word “uncertainty” has been bandied about frequently in recent weeks. The Trump Administration has an ambitious agenda to shake up global trade and politics and make them more friendly to American interests, but that is exceedingly difficult under even the best circumstances. It will require a level of diplomacy that is so far not in evidence. I am not speaking from personal conviction here, I am simply conveying the message of the markets, and so far that message has not been very favorable. As the rally on April 9th demonstrates, there is room for asset prices to improve dramatically if tariffs are abandoned, but I have no thought that going through all of this for nothing would be regarded by markets as positive either. Because of the increased levels of both volatility and uncertainty, we at Trademark believe we have to exercise more caution, at least in the short term, than we have had to in recent years. We take our responsibility as manager of your assets extremely seriously. Over the past decade, stock market sell-offs have provided very good “buy-the-dip” opportunities. I am not as confident that this is the approach to take this time.
[1] S&P 500 large company index, according to Standard and Poors. The NASDAQ Composite fell -10.3% and the Russell 2000 small cap index sank -9.5% according to Nasdaq.com.
[2] This prompted James Carville, Clinton’s political strategist, to opine that if he were ever resurrected, he’d like to come back as the bond market because then he could intimidate everyone.
[4] A laudatory phrase from 19th century French political philosopher Alexis de Tocqueville.
[i] A large part of the problem, as many in the market have stated, was that wasn’t clear why we needed to end the era of American market exceptionalism. If you look at a chart of relative performance, the U.S. was by far the largest beneficiary of the status quo over the last fifteen years or so. There is no economic policy that guarantees that absolutely everybody will do better. Clearly, many industrial jobs were lost during this time period (though far more were lost between 1985 and 2000). Congress sent money to the states many times to try to alleviate the economic pain of those who lost their jobs, but some states simply pocketed it or cut taxes (which, while nice, does nothing to help someone who isn’t earning any money).
In any event, we have begun a policy of blaming and punishing our trading partners for taking jobs we gave U.S. corporations tax incentives for moving under the Reagan, George H.W. Bush, and Clinton Administrations. Needless to say, those countries aren’t happy about it. So far, those industries most exposed to tariff concerns have fared worse than those that largely do business domestically, but even energy, which Trump promised specifically to help, has seen losses over 15% as global demand falls.
DISCLOSURE
Past performance is no assurance of future results. Trademark Financial Management, LLC (“Trademark”) is a registered investment adviser with its principal place of business in the State of Minnesota. Trademark and its representatives are in compliance with registration requirements imposed upon investment advisers by those states in which Trademark operates. Trademark may only transact business in those states in which it is registered or qualifies for an exemption or exclusion from registration. This newsletter is limited to the dissemination of general information pertaining to its investment advisory/management services. Any subsequent, direct communication by Trademark with a prospective client shall be conducted by a representative that is either registered or qualifies for an exemption or exclusion from registration in the state where the prospective client resides. A complete list of all recommendations will be provided if requested for the preceding period of not less than one year. It should not be assumed that recommendations made in the future will be profitable or will equal the performance of the securities in this list. Opinions expressed are those of Trademark Financial Management and are subject to change, not guaranteed and should not be considered recommendations to buy or sell any security. For information pertaining to the registration status of Trademark please contact Trademark at (952) 358-3395 or refer to the Investment Adviser Public Disclosure web site (www.adviserinfo.sec.gov). For additional information about Trademark, including fees and services, send for our disclosure statement as set forth on Form ADV from us using the contact information herein or by calling 952-358-3395. Please read the disclosure statement carefully before you invest or send money. Any reference to a chart, graph, formula, or software as a source of analysis used by Trademark Financial Management staff is one of many factors used to make investment decisions for your portfolio. No one graph, chart, formula, or software can in and of itself be used to determine which securities to buy or sell, when to buy or sell them, or assist any person in making decisions as to which securities to buy or sell or when to buy or sell them. Any chart, graph, formula, or software used is limited by the data entered and the created parameters. The data was obtained from third parties deemed by the adviser to be reliable. Nonetheless, the adviser has not verified the results and cannot be assured of their accuracy.
Summary
With dividends reinvested, the S&P 500 gained close to 25% in 2024, but only 2.4%1 of that came in the final three months. Stocks lost one percent in October (as is typical in the month leading into a presidential election). Stocks then rose 5.7% in November in what many market pundits referred to as the “Trump bump”, as investors looked favorably on the potential for less regulation and more merger activity. December saw the market give back almost half of that (-2.5%) as investors digested the policies of the president-elect and winced at their inflationary implications. Bonds had a fairly poor quarter (-3.1%) as interest rates rose sharply post-election. As a result, the full-year gain was cut to 1.3%. Small and mid-cap stocks are even more sensitive to interest rate movements than large caps; they rose 9% post-election, then gave almost all that back very quickly to finish the quarter with just a 0.3% advance. Interestingly enough, there was no “Santa Claus rally” during the final trading days of 2024.
The biggest losers in November’s election may have been foreign stock investors. Largely because of threatened tariffs, foreign stocks lost -7.6% in U.S. dollar terms last quarter. Weakening prospects for economic growth in both Western Europe and China also played a part. Latin America, led by Brazil, was by far the poorest-performing region last quarter. Asia also struggled as Indian stocks took a breather after strong performance earlier in the year. Europe lost close to -8% during the quarter and the “winner”, Japan, still gave back five percent. Many argue as to whether there is value to be had in investing outside the U.S. It is true that foreign markets are less expensive in terms of valuation, but the growth rates and the profit margins of their companies tend to be quite a bit lower. With a company like Taiwan Semiconductor, however, you can get a high growth rate and a high profit margin with a price-to-earnings multiple lower than the average U.S. stock. Foreign stock investors just have to be more selective, which is why we very seldom index our foreign stock exposure, and why we underweight foreign stocks versus the global benchmark.
Bonds had a rough quarter. They rose over -3% to end the year up just 1.3%. A lot of bond analysis focuses on inflation as if that were the only important factor in where bonds prices go. Another factor and one that is taking on increasing significance these days is issuance versus demand. Simply put, if you try to sell more bonds than the bond market has the capacity or interest in buying, prices are going to go down – regardless of what inflation is doing. Inflation didn’t jump last quarter but because buyer interest in financing U.S. debt declined, the U.S. government had to offer higher yields to attract borrowers. Since corporate and mortgage debt is priced as a spread over U.S. government debt (because the government is less likely to default than a private payer), everybody’s borrowing costs rose. Only those bonds where the yield is attractive (higher) relative to government bonds (yet their default risk is still low) provide good returns in this environment.
Gold and cryptocurrency had a strong year. Gold rose largely because investors worldwide sought an alternative to questionable central bank and government policies. Cryptocurrencies surged as U.S. regulators approved ETFs that hold individual crypto tokens, such as bitcoin and Ethereum. They got a further boost after the election as President Trump promised to be a big crypto advocate.
Activity
Typically, markets are quiet into an election, and afterward, a narrative emerges in terms of which industries will be winners and which will be losers under the new regime. This time, it happened, but with a twist. It wasn’t about which industries would be losers but which countries. Tariff threats dominated the post-election market environment, so most market participants (even those overseas) figured that the best thing to do was invest in the U.S. to avoid that risk. The U.S., primarily because of its economic size and military strength, has the least to lose if global trade breaks down, though everyone would be a loser to some extent. Doing the math, the prudent play for asset allocators was to reduce international exposure, both developed and emerging, relative to US equity exposure. The second part of the tariff equation is higher interest rates, further stressing bond market didn’t have to do much. We were already defensive on the bond side and therefore had a lot less to lose from rising rates.
The other portfolio management consideration we had to address was determining the appropriate amount of large-cap technology exposure. Too little and you increased the amount you under-performed the index (which held over 35% in just eight companies at year-end); too much and you introduce too much risk to the portfolio since all investment manias ultimately end. In some portfolios, we added, and in some, we subtracted. More on this in the Commentary section.
Outlook
Writing this on Friday afternoon, January 17th, it is difficult to say where we are going to go from here. At this point, the U.S. economy is fairly strong and corporate earnings are expected to post low double-digit gains. Interest rates usually determine if the market will perform better than earnings would suggest or worse. So far this year, interest rates are up a little bit, so market gains have been modest.
All that said, we are soon to see the impact of tariffs on a scale we have never seen before (if the new President’s words are to be believed). We know that tariffs did not work in the late 1800s, and we know that they did not work AT ALL after the Smoot-Hawley Act was passed in 1930. However, it could be argued that the U.S. depended more on foreign trade in the late 19th and early 20th centuries then and was not the economic powerhouse that it is now. Since Trump’s election, markets have definitely made the calculation that since America is less dependent on its trading partners, it has less to lose from a trade war. As a result, investors have shifted assets out of countries and currencies that would be vulnerable to an economic attack from the United States. As U.S. investors, we have benefitted from this shift in the short run (more demand for dollar-based assets). It remains to be seen how long the benefit lasts. Whatever we do is bound to, at some point, produce a counter-response. It is for this reason that many strategists look for the first half of the year to be stronger than the second half.
Commentary – Risk Management Amid a Possible Speculative Bubble
2024 was another strong year for the U.S. stock market so it is probably a good time to discuss market returns and portfolio returns, as well as risk tolerance and fiduciary duty. Hopefully, this will help you to understand why stock index returns can differ a lot from portfolio returns in both directions (but typically, index returns are higher when the market is up).
First of all, I would like to point out how much investing has changed over the years. One hundred years ago, even sixty years ago, most investing was done through the trust department of banks. That is where people with significant wealth put their money because banks had a duty of care that stockbrokers didn’t have. If a bank lost your money through imprudent investments, it was legally liable to you. If you lost money with a stockbroker, on the other hand, you needed to prove fraud to have any recourse. Investing got a jolt in the 1960s as the stock market soared on the back of new technologies—integrated circuits, mainframe computers, instant photography, etc. Investors got frustrated by the safe but low-yielding options offered them by banks (bonds, preferred stocks, etc.), so as they did in the 1920s when cars and radio were the big new things, they began to speculate. Ultimately, this ended in tears as well. The first oil crisis in 1973-74 was a harsh reminder that even technology can fall prey to a global economic contraction.
The tension between investing and speculating has evolved over the last fifty years. Fiduciary investing became dominated by mutual funds and then indexed exchange-traded funds (ETFs), with speculation being done through individual stocks and privately traded vehicles. Speculators had their day trading phase in the late 1990s and then moved on to leveraged ETFs, leveraged single stock ETFs, SPACs, meme stocks, cryptocurrencies, and zero day-to-expiration option contracts (0-DTE) more recently. New innovations in speculation have historically always happened just before the top of a market cycle (because at the beginning of a cycle, investors are more cautious than greedy). It seems to me that we are probably near the top of the cycle now partially because2 of all of the new speculative vehicles that have been recently introduced, but admittedly, this is a gut feeling and not something I can know for certain.
As a Registered Investment Advisor (RIA), however, I have certain legal responsibilities, and as a Chartered Financial Analyst (CFA), I have fiduciary3 and ethical requirements. I am, therefore on the investment side of the equation, not the speculative. As such, I am more like a bank than a broker. There are risks I cannot take with a client’s money, even if the client wants me to. That doesn’t mean I’m always going to be correct. Putting all of someone’s money in Apple or Tesla ten years ago was not prudent from a fiduciary standpoint; it might have resulted in a complete loss. Obviously, we now know that it didn’t – those stocks turned out to have been far more lucrative than any diversified portfolio one could have owned. Things always look clearer in hindsight.
There is another component to what securities regulations and the CFA Standard require of me that you might not be aware of—abut you should be. As a fiduciary, I place your interests ahead of my own and my firm’s interests. Part of that is not lying to you making misrepresentations. The person on TV or radio selling you gold, real estate, or bitcoin is not similarly bound because those offerings are not securities. No, gold is NOT guaranteed to keep up with inflation. Sometimes it does, sometimes it doesn’t. Gold can and has trailed inflation for decades at a time. And, NO, you cannot buy top-quality real estate offering double-digit returns at below-market prices. The seller is not an idiot. If it is indeed top quality, high-returning real estate, and you offer a below-market price, somebody will outbid you. I say these things because I am frustrated with the current get-rich-quick environment—I see many things that I recognize from bad times past. One of them is technology mania.
I don’t want to sound like a Luddite when I discuss artificial intelligence (AI). I believe AI will revolutionize many fields. It will change forever the way we do certain things. That said, similar things were said about the personal computer, the internet, fiber optics, and cloud computing, and ultimately all came true. Yet these permanent changes in the way we live and work did not prevent investors from experiencing substantial drawdowns. Each of these areas went through what is known as the Gartner Hype Cycle.
Stocks soared on the promise of the new technology (the sky was almost literally the limit), then fell back sharply as profits were slower in coming even as usage of the new technology ramped up. Eventually, the new technology generated profits that could be predicted and valued, and gains in these stocks were more linear than exponential.
When I have written in the past about the concentration of investment returns and market capitalization in a surprisingly small number of companies, this is what I’m talking about. The idea that it is not financially prudent to concentrate so much of one’s investment portfolio in one industry (technology) or in one country (the U.S., obviously). An institutional investor like the Minnesota Public Employees Retirement Plan or an endowment like the University of Washington’s UWINCO would never be invested that way. Your money shouldn’t either.
So, getting back to the question of what one should expect in a year like 2024, here is how I see it: Large U.S. stocks returned 25%. The biggest 7 stocks gained 64%, but the other 493 companies in the S&P 500 gained around 18%. Stocks smaller than that averaged 11.5%. Since large caps are 80%+ of the market, weighting large stocks higher relative to small gives one about a 22% expected return on an all-U.S. portfolio (22.5% with a modest top 7 overweight). Foreign stocks gained a dismal 5.5%, and that was only achieved by virtue of a 10.6% emerging markets return. In contrast, developed markets ex-U.S. gained 3.2%. It was difficult to achieve even that 5.5% because it required just under 9% in China (one of the best-performing foreign markets last year).4 Given that about two-thirds of global market capitalization is in the U.S., a global stock portfolio should have returned about 17% last year.5 It would not have been a stretch to have foreseen that U.S. stocks could probably outperform, so a three-quarters U.S.-to-foreign ratio seems more appropriate. That puts global stock returns at 18.2%.
The rest of a portfolio is made up of bonds and alternatives. The Bloomberg Aggregate Bond Index gained 1.3% last year, but no good bond manager failed to beat that easily6 because short-term rates were closer to 5%. Let’s agree on 3% for U.S. bonds as a reasonable return. International bonds gained about 4.5%; since 5/7 of the global liquid debt market is the U.S., we wind up with a net global bond return of 3.5%. Alternatives like gold would have added to returns last year, but other commodities (chiefly oil) and real estate would have negated much of gold’s impressive surge.
In the end, a naïve (indexed) 50:50 stock and bond portfolio would have returned about 9.6% before fees (17%+2.2% divided by two), whereas an intelligently-weighted portfolio would have returned closer to 11% (18.2%+3.5%). Obviously, actual portfolios will almost certainly have a different stock-bond ratio than 50:50. This exercise should provide a template to figure out expected performance. In some years, active individual mutual funds and ETFs give us a bigger boost because we are able to lean into established trends. In other years, however, markets shift away from factors that have been previously very successful, and that shift takes a while to reveal itself as permanent.7
I realize in that in this commentary, I’ve thrown a lot at you. There was just so much to say. I wanted to explain why I feel we are in another era that is fraught with danger for investors. I wanted you to know how much thought goes into portfolio construction. I feel it is very important for you to be able to distinguish between investment and speculation, and though we on the investment side don’t always get it right we always have your interests first. Lastly, I wanted you to know how we assess 2024, a rare year in which one area the market was exceptionally strong but so much more of it provided much more modest returns.
[1] Charles Schwab “It was a Very Good Year” commentary and table, Jan 6, 2025. ↩︎
[2] And also because of the current high historical valuation of the market. ↩︎
[3] Fidiciary is defined as someone who is required to act in the best interest of someone else. The CFA Standard requires me to act with reasonable care and exercise prudent judgment. ↩︎
[4] Trump might have aimed at China post-election, but the bullets hit Europe. ↩︎
[5] Vanguard’s flagship Total World Stock ETF gained 16.5% in 2024 ↩︎
[6] We are in an era where the top stocks are extremely difficult to beat but the top bonds (by issuance) are very easy to outperform. ↩︎
[7] Last year “wide moat” investment strategies broke down. Wide moats are businesses with high barriers to entry that make them hard to compete with. Alphabet (Google) has a wide moat (search), but so does Boeing. There is no guarantee that these companies will be well managed. ↩︎
DISCLOSURE
Past performance is no assurance of future results. Trademark Financial Management, LLC (“Trademark”) is a registered investment adviser with its principal place of business in the State of Minnesota. Trademark and its representatives are in compliance with registration requirements imposed upon investment advisers by those states in which Trademark operates. Trademark may only transact business in those states in which it is registered or qualifies for an exemption or exclusion from registration. This newsletter is limited to the dissemination of general information pertaining to its investment advisory/management services. Any subsequent, direct communication by Trademark with a prospective client shall be conducted by a representative that is either registered or qualifies for an exemption or exclusion from registration in the state where the prospective client resides. A complete list of all recommendations will be provided if requested for the preceding period of not less than one year. It should not be assumed that recommendations made in the future will be profitable or will equal the performance of the securities in this list. Opinions expressed are those of Trademark Financial Management and are subject to change, not guaranteed and should not be considered recommendations to buy or sell any security. For information pertaining to the registration status of Trademark please contact Trademark at (952) 358-3395 or refer to the Investment Adviser Public Disclosure web site (www.adviserinfo.sec.gov).
For additional information about Trademark, including fees and services, send for our disclosure statement as set forth on Form ADV from us using the contact information herein or by calling 952-358-3395. Please read the disclosure statement carefully before you invest or send money. Any reference to a chart, graph, formula, or software as a source of analysis used by Trademark Financial Management staff is one of many factors used to make investment decisions for your portfolio. No one graph, chart, formula, or software can in and of itself be used to determine which securities to buy or sell, when to buy or sell them, or assist any person in making decisions as to which securities to buy or sell or when to buy or sell them. Any chart, graph, formula, or software used is limited by the data entered and the created parameters. The data was obtained from third parties deemed by the adviser to be reliable. Nonetheless, the adviser has not verified the results and cannot be assured of their accuracy.
Trademark Blog Post – December 11, 2024:
The U.S. stock market surged after the November election. Investors remembered that in the first year of Donald Trump’s first term (2017), in which taxes were cut, regulations were curtailed, and government spending took off. This combination made for a very good year for stocks, so the market is betting on the same combination in 2025. It may happen, but it’s important to note that the economy was growing at a much slower rate in late 2016 and inflation wasn’t on anybody’s mind back then. A tax cut not offset by fiscal restraint (spending cuts) would probably unnerve the bond market, leading to higher interest rates. The selection of Scott Bessent for Treasury Secretary initially helped calm the bond market due to his long career on Wall Street.
Much of the fuel for the gain in the U.S. stock market has come from investors shifting out of foreign stocks and currencies. It appears investors (both here and abroad) feel that at least initially the proposed tariffs will take a larger bite out of foreign stocks and currencies. The big question for 2025 and beyond is – how big will the response be?
Another thing that seems to be driving markets recently is the explosion in digital assets. While the U.S. stock market is 6.6% ahead of its close the day before election, bitcoin is 50% higher. Some tokens have done even better. The proximate cause for this is that the incoming Trump Administration promises to be much more friendly to “cryptos” than the Biden Administration’s regulators were. Gains of 50% or more in a very short time period in several of the digital tokens drove investors into a bit of a speculative frenzy, because they believe they can really get rich quick. This bled over into stocks; the artificial intelligence and quantum computing sub-sectors have soared almost as much as digital assets. Markets that trade on hope and greed are exciting, but they tend not to end well. If money management were nothing more than performance chasing, we would know where to invest, but we could not guarantee we’d have a chair, so to speak, when the “music” stopped playing. This is an exciting but dangerous time to be an investor.
Fraudsters don’t take holidays:
With the holiday season upon us fraudsters are ready to take full advantage of any opportunity to gain access to personal information. Both Trademark Financial Management and Charles Schwab are committed to protecting your private information. Schwab released a list of common fraud methods to help you, and your friends, family, and colleagues shop safely this holiday season.1
First, be sure you’re familiar with the most common fraud methods:
Phishing /Email Account Compromise: Scammers send deceptive emails, texts, or messages designed to trick recipients into clicking malicious links or revealing sensitive information, often by impersonating reputable organizations. Additionally, thieves may attempt to gain access to e-mail accounts and use them to intercept financial communications or initiate fraudulent requests. Remember to always verbally verify all money movement instructions received via e-mail–including 1st party money movement requests.
Social engineering: fraudsters may pose as trusted retailers, charities, or even friends, pressuring victims into providing sensitive information or making payments. Stay skeptical of unsolicited requests and verify independently before acting.
Financial account takeover:Fraudsters use stolen credentials, malware, or breached information, to gain unauthorized access to accounts, often using the holiday season’s surge in online shopping to make unauthorized credit card purchases or transfers. Monitor accounts closely and report suspicious activity immediately.
Questions to ask when shopping online:
Are you on a secure network? It’s easy to hit the “Buy” button from anywhere when you are on your phone or laptop. But if you’re shopping on a public network, your personal information—and your credit card number—might be intercepted by scammers. Wait to purchase until you’re on a secure network.
Is this retailer or website genuine? Fraudsters set up convincing fake online stores offering discounts that are too good to be true. Always verify the legitimacy of websites before entering personal or payment information.
Is this shipping update legit? Be wary of unexpected emails or texts claiming to be from shipping companies asking you to click on links to confirm delivery details. These links often lead to malware or phishing attempts.
How do I know this gift card is valid? Gift cards are convenient, but they can open the door to scams. To ensure your gift card is protected, avoid the rack, and ask for one directly from the person behind the counter. And remember—no legitimate retailer or charity will demand gift cards for payment.
Can I trust this deal I saw on social media? Too-good-to-be-true deals on social media sites are often illegitimate. Carefully read reviews, look for security credentials on websites, and research unfamiliar retailers before you take advantage of a discount. A secure site will display https:// in the URL and a padlock icon in the address bar.
Can I pay by credit card? These cards offer the best protection against fraudulent transactions.
What does the Better Business Bureau have to say? Their scam BBB Scam Tracker can help you identify crimes and issues that are occurring in your area.
Both successful and prevented fraud attempts should be reported immediately.
On a personal note:
On Wednesday morning my mother, Donna Carlton, died at the age of 83. She had a 33-year career in financial services, starting out in 1977 when there were very few women in the industry and almost none in any kind of leadership role. She was successful because she worked very hard and she really cared about her clients. She gave me my start in the industry as an office assistant and early computer software user, and in doing so I found an aptitude for the analytical side of the business. Her father, my grandfather, had owned a dry goods store on the Iron Range in its heyday. He always told her that if you took care of your customers, they would take care of you. That is how she ran her business until she retired in 2010, and what I learned from her. I will always be in her debt.
Past performance is no assurance of future results. Trademark Financial Management, LLC (“Trademark”) is a registered investment adviser with its principal place of business in the State of Minnesota. Trademark and its representatives are in compliance with registration requirements imposed upon investment advisers by those states in which Trademark operates. Trademark may only transact business in those states in which it is registered or qualifies for an exemption or exclusion from registration. This newsletter is limited to the dissemination of general information pertaining to its investment advisory/management services. Any subsequent, direct communication by Trademark with a prospective client shall be conducted by a representative that is either registered or qualifies for an exemption or exclusion from registration in the state where the prospective client resides. A complete list of all recommendations will be provided if requested for the preceding period of not less than one year. It should not be assumed that recommendations made in the future will be profitable or will equal the performance of the securities in this list. Opinions expressed are those of Trademark Financial Management and are subject to change, not guaranteed and should not be considered recommendations to buy or sell any security. For information pertaining to the registration status of Trademark please contact Trademark at (952) 358-3395 or refer to the Investment Adviser Public Disclosure web site (www.adviserinfo.sec.gov).
For additional information about Trademark, including fees and services, send for our disclosure statement as set forth on Form ADV from us using the contact information herein or by calling 952-358-3395. Please read the disclosure statement carefully before you invest or send money. Any reference to a chart, graph, formula, or software as a source of analysis used by Trademark Financial Management staff is one of many factors used to make investment decisions for your portfolio. No one graph, chart, formula, or software can in and of itself be used to determine which securities to buy or sell, when to buy or sell them, or assist any person in making decisions as to which securities to buy or sell or when to buy or sell them. Any chart, graph, formula, or software used is limited by the data entered and the created parameters. The data was obtained from third parties deemed by the adviser to be reliable. Nonetheless, the adviser has not verified the results and cannot be assured of their accuracy.
Summary
The third quarter of 2024 was an investment advisor’s dream. Performance was very good, but better yet it was widely distributed (meaning one didn’t have to overweight a small segment of the market in order to obtain superior returns). In fact, the largest tech stocks as a whole were a drag on performance during the quarter; almost every other part of the market performed better. The S&P 500 rose 5.9% last quarter, but eight of the eleven industry groups rose more than that. Real Estate, Industrials, and Financial Services each gained more than 10%. Technology, up just 1.6%, ranked tenth (energy was last at -2.3%)1. Almost all areas of the U.S. stock market hit all-time highs last quarter. Only real estate and consumer discretionary (retail, in other words) remain below their 2021 highs.2
The best explanation for the stock market surge is that the economy was expected to show signs of weakness by now but it hasn’t, while inflation was expected to decline and it has – at least enough to allow the Federal Reserve to start cutting interest rates. A strong economy, decelerating inflation, and lower borrowing costs? Buy me some stocks! This is what market professionals call a “Goldilocks” situation. Instead of being forced to buy a small list of recession-defying technology leaders, investors discovered they could make money almost anywhere – especially in beat-up places like real estate, banks, and miners. There is nothing wrong with tech leaders like Microsoft and Apple – investors were just ready to take some profits after a very profitable run.
Foreign stocks also had a nice third quarter. According to MSCI, foreign stocks rose 7.2% last quarter and are ahead 13% for the year. JPMorgan computes the foreign stock discount versus the U.S. now at a record 35.9%,3 but profit margins and earnings growth are just so much better here. At some point the discount is going to widen meaningfully, but I’m not betting on that day being soon. Taiwan has done well in 2024 because its market is dominated by semiconductor giant TSM. China surged in late September on hopes for a major fiscal stimulus program, but here in October this has largely fizzled. India has probably been the most consistently strong foreign market this year.
Bonds had a very strong (5.2%) quarter, more than erasing their first half loss. With inflation falling to less than 3% and the Fed cutting rates a surprising 50 basis points in September, bonds were primed to perform. Short-term bonds were better in the first and second quarters because interest rates were still high, but rate cuts tend to bring big gains to longer duration bonds. That is what we saw in the third quarter. Riskier corporate bonds and private debt are way ahead year-to-date, but treasury bonds and notes did better last quarter. If the economy is as strong as the stock market seems to think it is, however, bond prices will not stay this high. In fact, they’ve given back two percent so far this month.
Gold gained 7.2% last quarter. As the spread between bold yields and interest rates narrows, gold becomes more attractive. We have been selectively adding.
Activity
July and August are typically strong months for the stock market, but September is not. Stocks fell in four of the last five Septembers going back to 2019. Given economic concerns and knowing that the election typically brings uncertainty, we were prepared for another rough September. The surprisingly strong August employment report (released September 6th) and the favorable inflation report the following week reset expectations and necessitated more “risk-on” choices in U.S. small and mid-cap stocks and in bonds. We expected to trim stock positions into market weakness in September, but since there wasn’t any weakness, we made very few sales. As a result, we have been fully able to participate in a rally that is now in its sixth week.
Wild international market swings around Japanese central bank currency policies and Chinese economic stimulus (or lack thereof) made the quarter difficult because they caused huge fluctuations in the yen in the first case and in Chinese equities (and by extension all emerging markets) in the second. Given the superior earnings predictability of U.S. companies over foreign ones, we shifted a little bit of foreign exposure to the U.S. despite our market’s rich valuation.
Outlook
I can’t imagine putting down an outlook right now with a high degree of confidence. The investment community was more concerned than it should have been about an economic slowdown beginning by the end of 2024, but it is hard to say that we are completely out of the woods. The markets don’t seem afraid of either candidate being elected, strange as that may seem (or is equally afraid of both?). I am always more comfortable when there is some fear out there because that (fear) represents money that is not currently invested that in the future could push prices higher. When nobody is worried and everyone is all-in, where is the next price surge going to come from?
These charts from JPMorgan shows the Price to Earnings Ratio of the U.S. stock market today compared to the average of the past 20 years. This removes misleading low readings from the Depression and the high inflation 1970s. It shows the extent to which one has to pay up for growth (technology, etc.) stocks today. Today’s growth stock investor is making an implicit bet that the advantages that U.S. stocks have will continue for a long time.
The chart below references the Q-Ratio for the S&P 500. Tobin’s Q is a measure of stock prices relative to replacement value. In essence it argues that you could build a new Apple or Nvidia far cheaper than it would cost you to buy up all the company’s stock. Which is over $3.5 trillion each, if you were wondering.
Commentary – Time to Pull Down the Safety Bar
In the charts preceding this Commentary, I’m trying to emphasize that U.S. stocks are really expensive relative to market history. I want to stress that this does not mean that stock prices are going to fall meaningfully anytime soon. It simply means that there is no “low hanging fruit” (attractive opportunities at cheap prices) anymore. Companies and industries that have above average growth prospects are currently fully priced to reflect their potential. Today, you have to pay much higher prices for the opportunity to earn superior returns, and some of those opportunities won’t pan out.
The best analogy I can give is riding up in a chair lift at a ski resort in the Rocky Mountains. Most of the ride has you going up over the snowy incline. If you were to somehow fall forward off the lift, you would fall into the snow from 20-25 feet. You might break an ankle or a leg, but it is unlikely to be fatal. That is how I look at the stock market most of the time. Every time people give me a scary “what if” hypothetical – what if the national debt doubles, what if inflation surges like it did in the 1970s, what if the Middle East totally goes to war, etc. I think of those events as having a serious impact on markets but not being catastrophic to portfolios. A metaphorical broken ankle, so to speak – it hurts, it takes time, but you expect to fully recover.
Notice, however, that in the chair lift analogy I wrote “most of the time”. There is a stretch on the mountain where the chair lift goes over a ravine where the snowmelt from higher altitudes runs off. You would not survive a fall here. At present, the U.S. stock market is at very high altitude and the distance between where it is now and the historical median (not the bottom but the long term average) is really wide. Read the charts above as telling you that in the event of a crisis, stock prices could fall much more than they would have in 2014 or 2004 or 1994.
I do not write this because I expect it to happen anytime soon. I don’t, and I’m not aware of any credible market professional who does. There is just too much liquidity out there right now. Price declines get bought before they get significant. The point is, almost nobody ever expects large sell-offs to happen, even though history is full of them. We are going through an incredible period for stocks right now for several good (justifiable) reasons:
· The U.S. leads the world by far in the fastest growing industry (technology)
· Corporate profit margins at the highest in the world, and because of technology those profits are growing
· The U.S. has a culture of shareholder activism which forces underperforming companies to change.4
Faster growth, greater profit growth, and better “recycling” of mis-spent capital are very good reasons to continue to overweight U.S. companies. Primarily because of these factors, U.S. future outperformance is taken for granted.5 U.S. stocks have outperformed foreign stocks for so long that I’m not even going to put up that performance chart again. I observe that strong stock returns have allowed U.S. investors to support the economy through spending some of those gains,6 and that this has helped us avoid recession when we had cyclical slumps in 2015, 2018, and 2022 but – there is no guarantee that this will always bail us out. A declining stock market could lead to a negative feedback loop where falling portfolio values depress spending and worsen an economic downturn, causing more selling.
One way or another, there will be a point in our future that all of the factors that have led to massive U.S. outperformance will not be working for us. Price-earnings ratios will have fallen. The market’s price will no longer exceed the median line on the chart. If my investment horizon is five years or less, I probably don’t care – I will most likely have gotten out of the market beforehand. If, on the other hand, my investment horizon is 20-25 years or more, then I need to start thinking about investing differently. I probably will experience the end of the virtuous cycle of massive Federal Reserve liquidity and its resulting wealth effect. Because I will experience the next severe downturn,7 I need to ensure I can financially survive that fall. I should, as Morningstar’s Dan Kemp suggests, trade in my race car for an SUV. That means giving up some near-term performance in favor of added safety features.
It means taking some profits in stocks and putting the proceeds in cash equivalents, gold, and alternatives whose performance is not primarily driven by interest rates or economic cycles. Each of these would be expected to perform better in a crash than stocks would.
In summary, as U.S. stock investors we have enjoyed a tremendous run over the very long term (since the end of World War 2), the long term (since the peak of inflation in 1981), the intermediate term (since the March 2009 financial crash market bottom), and the short term (since the end of the 2022 correction). No other market, no other investment class can touch what U.S. stocks have done over the long term. And as far as I know, they will continue to perform well. At this point, however, it may be time to think about pulling down the safety bar on this lift. I can’t help but remember that the greatest American economist of his time, Irving Fisher, didn’t see the Depression coming less than two weeks before the 1929 market crash.8 I wouldn’t be writing this if stocks weren’t so far above their long-term averages; if they weren’t, the consequences would be much more manageable. My goal isn’t to scare people but to ask everyone with a long-term horizon to think a little less about maximizing portfolio value and a little more about being protected when things change. Inevitably, they always do.
[1] JPMorgan Guide to the Market 4Q24, page 15. ↩︎
[2] Energy actually made its all-time high in 2022 when the other industry groups were falling. Energy often moves opposite to the bond market, which is why it’s a good diversifier. Gold, on the other hand, tends to move higher when interest rates fall (as stocks usually do) which is why it isn’t a very good diversifier. ↩︎
[3] JPMorgan Guide to the Market 4Q24, page 47. ↩︎
[4] Harry Mamaysky, US Versus International Stock Performance, Advisor Perspectives, 10/14/2024 ↩︎
[5] It could be argued that U.S. stocks are the greatest momentum trade ever. Over the years it was argued that various countries were poised to challenge U.S economic dominance (Japan in the late 1980s, China as recently as a few year ago), but there are really no competitors today. ↩︎
[6] There are 21.9 million millionaires in the U.S., according to Wikipedia ↩︎
[7] The 1973-74 crisis took nine years to recover, (20 in inflation-adjusted terms) and the 2000-09 dot com crash/great financial crisis took twelve years, (15 adjusted for the lower inflation of the 2000s). ↩︎
[8] Fisher proclaimed that “Stocks have reached a permanently high plateau” on October 16, 2029 Black Thursday, the Wall Street Crash, occurred eight days later. ↩︎
DISCLOSURE
Past performance is no assurance of future results. Trademark Financial Management, LLC (“Trademark”) is a registered investment adviser with its principal place of business in the State of Minnesota. Trademark and its representatives are in compliance with registration requirements imposed upon investment advisers by those states in which Trademark operates. Trademark may only transact business in those states in which it is registered or qualifies for an exemption or exclusion from registration. This newsletter is limited to the dissemination of general information pertaining to its investment advisory/management services. Any subsequent, direct communication by Trademark with a prospective client shall be conducted by a representative that is either registered or qualifies for an exemption or exclusion from registration in the state where the prospective client resides. A complete list of all recommendations will be provided if requested for the preceding period of not less than one year. It should not be assumed that recommendations made in the future will be profitable or will equal the performance of the securities in this list. Opinions expressed are those of Trademark Financial Management and are subject to change, not guaranteed and should not be considered recommendations to buy or sell any security. For information pertaining to the registration status of Trademark please contact Trademark at (952) 358-3395 or refer to the Investment Adviser Public Disclosure web site (www.adviserinfo.sec.gov).
For additional information about Trademark, including fees and services, send for our disclosure statement as set forth on Form ADV from us using the contact information herein or by calling 952-358-3395. Please read the disclosure statement carefully before you invest or send money. Any reference to a chart, graph, formula, or software as a source of analysis used by Trademark Financial Management staff is one of many factors used to make investment decisions for your portfolio. No one graph, chart, formula, or software can in and of itself be used to determine which securities to buy or sell, when to buy or sell them, or assist any person in making decisions as to which securities to buy or sell or when to buy or sell them. Any chart, graph, formula, or software used is limited by the data entered and the created parameters. The data was obtained from third parties deemed by the adviser to be reliable. Nonetheless, the adviser has not verified the results and cannot be assured of their accuracy.
Summary
The S&P 500 gained 4.3% last quarter, and 15.3% in the first half of the year.1 That is the good news. The bad news was that this return was driven by a handful of stocks; the market as a whole did not make nearly as much. The Dow Jones Industrial Average declined -1.7% last quarter, and the Russell 2000 Small Cap Index gave back -3.3%. The U.S. stock market has been trading on the premise that the economy is slowly moving toward recession and in that environment only large companies with strong balance sheets and large cash hoards can prosper. There may only be 15-20 companies that qualify, but these companies comprise over 50% of the market capitalization of the S&P 500 index. Oddly enough, we have many days where the top handful of firms move in the opposite direction as the rest of the stock market. More on that later.
Foreign market performance reflects the strength of the U.S. dollar. In local currency terms, foreign markets are up 11% but to U.S. dollar investors (like ourselves) foreign markets are up only 6%. The poorer performance of international stocks in U.S. dollar terms is why we hedge about 30% of our international stock exposure. The dollar has been particularly strong against the Japanese yen, where hedging has improved returns by 15%. In the case of a stronger currency, such as the Indian rupee, the performance difference is only 0.3%. Taiwan has been the strongest foreign market due to one superstock (Taiwan Semiconductor Manufacturing Company). Brazil has been the worst of the large foreign markets.
Bonds were interesting last quarter. Ostensibly, the bond market returned nothing (0.0%) in the second quarter, leaving year-to-date performance of the Bloomberg US Aggregate benchmark at -0.7%. However, unlike with stocks and the S&P 500, it is comparatively easier to find bonds not in the benchmark that outperform. We use a higher portion of short-term bonds in our portfolios and with the Federal funds rate at 5.37%, these positions returned about 1.3% over the quarter. Our longer-term bond funds tend to have a higher exposure to out-of-benchmark bonds, non-rated bonds, and credit, and these positions earned over 0.5% for the quarter on average. A smaller percentage of bond portfolios were invested in opportunistic public credit or private credit, which generated nearly 2% over the quarter, on average.
Gold returned 3.5% in the second quarter. Hopes for interest rate cuts later in the year and concerns over the rising debt levels in the United States offset the headwind of a strong dollar. Other commodities barely budged. Oil prices continued to be restrained despite the continuing conflict and risks in the Middle East.
Activity
Most of the activity in the second quarter involved trimming or moving money out of what wasn’t working (small and mid-size U.S. stock funds, alternatives in the real estate or global infrastructure areas, and ETFs that focus on out-of-favor niches of the market). I believe the valuations of the largest companies in the S&P 500 are very rich by historical standards. However, I also know we haven’t had such an enduring period of technological domination of the economy before. I want to protect investors from the risks of extreme over-exposure to a sector, but I also need to provide competitive investment performance. The bottom line is that despite my concerns, I have had to increase the weightings of these stocks in portfolios. A strategy of “buy low, sell high” sounds good, but it has not worked well over the last ten years, and it hasn’t worked at all since March 2023. Again, more on that later.
Outlook
So much depends on which comes first: recession or interest rate cuts. If recession comes first, small stock prices are going to stay depressed, and large stock prices are going to converge with them on the downside. If interest rate cuts come first, investors will likely conclude that recession will be largely or completely avoided, and small-cap and value stocks will probably converge with large-cap stocks on the upside. If the worst of the inflation is behind us and the economic future is better, investors don’t need to limit themselves to 15 or 20 names; the vast majority of stocks will do better. The “safety premium” in those large technology names will be reduced because it isn’t needed. The dramatic, colossal outperformance by large tech stocks required an environment of “not too hot, not too cold”. That dovetailed nicely with what the Federal Reserve was trying to achieve (an inflation-reducing slowdown without an actual recession). This environment has already lasted a very long term and produced price distortions of epic proportions. One way or the other, I believe that is near its end.
An aside – yes, this is the Outlook section, but I have no desire to comment on the upcoming election. As the first few weeks of the quarter have shown, the outlook in one week is very different than the outlook in the following week.
Commentary – Buy Low, Sell High Versus Buy High, Sell Higher
It has long been the popular cliché – How do you make money on Wall Street? Buy low and sell high! My training as a financial analyst in the 1990s was all about trying to find undervalued securities and holding them until their value was realized. You didn’t chase the market – everybody knew that didn’t work. Mountains of studies were undertaken going back to the late 1920s and all of them concluded that finding a good company at a fair price and patiently holding that stock and collecting the dividend was the key to wealth accumulation. If that wasn’t enough, you had the Oracle of Omaha, Warren Buffett, admonishing the speculators and preaching discipline and patience. After all, you didn’t want to be like those speculators of the 1920s who wound up jumping out of windows when the market crashed or those who were wiped out when the Nifty Fifty craze ran smack into the Arab Oil Embargo in 1973.
As is often the problem with things we all know to be true, market certainties can cease being true. Buy high, sell higher is the competing strategy with “buy low, sell high.” It argues that the best way to make money is to buy stocks that are already doing well, because those companies are more likely to continue to do well. It offers the psychological advantage of buying winners that the other strategy does not. Value advocates had claimed, with apparently good reason, that the market doesn’t reward you for doing what is easy, or else every investor would be rich.
Starting about 10-15 years ago, things began to change. “Buy high, sell higher” began performing a lot better than a value-oriented strategy. Some of us market veterans believed that this outperformance was a cyclical anomaly and that in a few years the stock market would go back to behaving as it always had. Sometimes markets get a little frothy, but they always self-correct. We thought this would happen in late 2018 as higher rates caused a bit of a hiccup, but in 2019 the new paradigm re-asserted itself. We thought it again in 2020 after the sharp Covid plunge and again in 2022 with the inflation surge, but each time the most loved, most expensive stocks lapped the rest of the field. So much so that studies from 1946 to the present show that “buy high, sell higher” is a superior strategy. It seems that omitting the Depression Era is significant because surviving stocks had a very large bounce after the worst of the Depression passed which skewed the numbers. In any event, outside of a smashing of the stock market, momentum contributes positively to investment returns over the long term versus value. The question is, what do you do with this information now?
The easy answer would seem to be: “buy high and sell higher.” The data shows that the strategy works and it is certainly ingrained among stock investors today. When I started in the industry 37 years ago there was nothing that excited investors more than a stock that was trading for less than book value.2 It was like finding money on the street. Today nobody looks at book value. It might take years to realize that hidden value, whereas a hot stock can make you good money in an hour or two. But even if you accept the premise that “buy high, sell higher” is a superior strategy, you have to believe that 1) there is no new Depression coming; and 2) that the current period isn’t a distorting anomaly in the opposite direction of what the Depression Era was.
I recently attended a presentation on the current state of buy low, sell high (value) investing. The subtext was: “why isn’t it working anymore?” Of course, that was the wrong question to ask. The right question is: “why is buy high, sell higher (growth) investing doing so well?” The reason is that growth previously consisted of companies and industries for which their advantage was transitory. Falling commodity prices helped consumer and food stocks in the 1980s, but eventually, commodity prices leveled out. The pharmaceutical companies were the growth winners of the early 1990s, but over time expiring patents and regulatory scrutiny over price gouging caught up with them. We all know about the late 1990s dot.com boom and bust and the early 2000s banking and real estate rise and hard fall. The market was dynamic, and no company or industry stayed on top for more than a few years. If you bought high, chances are you bought close to the top and things didn’t work out all that well for you. Then came the platform technology companies.
By platform, I mean that the company was able to create its own ecosystem. You bought the product (iPhone, Tesla, etc.), and you were locked into paying for its services and upgrades. You used the service (Amazon, Google, Facebook) and their related applications made it difficult to go elsewhere. Nobody could effectively compete. There are streaming alternatives to Netflix and semiconductor chip alternatives to Nvidia, but right now they are not nearly as good. Platform companies command relative valuation levels today that are larger than the best companies of the last century could dream of. Maybe this is justified. But only if the world stops changing.
Some Charts of Interest
This is a chart of active management versus passive (index) management. What it shows is that it has been very difficult for active managers to beat the over the past ten years because the biggest stocks have done so much better than large stocks as a whole. When you go to mid-size and smaller stocks, you don’t find dominance by a few stocks and as a result managers beat indexes a greater percentage of the time.
There are some concern that inflationary cycles have two waves. The Federal Reserve has been reluctant to cut rates as the Fed did in the 1970s lest they get a similar result.Investors seem to be “all-in” for stocks right now. Current levels of loving stocks and hating bonds are reminiscent of past cycles, each of which preceded a decade or more of stock weakness.Following the previous chart, once a long-term uptrend ends (and I’m not saying we are at that point yet) investors have to be very creative in order to maintain purchasing power.
[1] JPMorgan 3rd Quarter 2024 Guide to the Markets page 15 ↩︎
[2] “Book value” meaning the current market value of a company’s assets minus it’s liabilities. ↩︎
DISCLOSURE
Past performance is no assurance of future results. Trademark Financial Management, LLC (“Trademark”) is a registered investment adviser with its principal place of business in the State of Minnesota. Trademark and its representatives are in compliance with registration requirements imposed upon investment advisers by those states in which Trademark operates. Trademark may only transact business in those states in which it is registered or qualifies for an exemption or exclusion from registration. This newsletter is limited to the dissemination of general information pertaining to its investment advisory/management services. Any subsequent, direct communication by Trademark with a prospective client shall be conducted by a representative that is either registered or qualifies for an exemption or exclusion from registration in the state where the prospective client resides. A complete list of all recommendations will be provided if requested for the preceding period of not less than one year. It should not be assumed that recommendations made in the future will be profitable or will equal the performance of the securities in this list. Opinions expressed are those of Trademark Financial Management and are subject to change, not guaranteed and should not be considered recommendations to buy or sell any security. For information pertaining to the registration status of Trademark please contact Trademark at (952) 358-3395 or refer to the Investment Adviser Public Disclosure web site (www.adviserinfo.sec.gov).
For additional information about Trademark, including fees and services, send for our disclosure statement as set forth on Form ADV from us using the contact information herein or by calling 952-358-3395. Please read the disclosure statement carefully before you invest or send money. Any reference to a chart, graph, formula, or software as a source of analysis used by Trademark Financial Management staff is one of many factors used to make investment decisions for your portfolio. No one graph, chart, formula, or software can in and of itself be used to determine which securities to buy or sell, when to buy or sell them, or assist any person in making decisions as to which securities to buy or sell or when to buy or sell them. Any chart, graph, formula, or software used is limited by the data entered and the created parameters. The data was obtained from third parties deemed by the adviser to be reliable. Nonetheless, the adviser has not verified the results and cannot be assured of their accuracy.
Summary
The stock rally that began in late October continued through this past March. The S&P 500 added 10.6% last quarter.1 Investors tended to favor companies with strong balance sheets because they don’t need to borrow in order to finance their activities (since interest rates are driving financing costs higher). Large companies are also the best able to capitalize on artificial intelligence (AI) at this point. Smaller companies did manage to add 5.2%.2 Investors had expected the Federal Reserve to begin cutting interest rates by now in response to a slowing economy, but the economy hasn’t weakened thus far, so rates have remained unchanged. Investors have decided that the glass is half full, so to speak, because a stronger economy means rising corporate profits even if interest rates remain at elevated levels. The critical issue for investors is that they get the rate cuts eventually; any suggestion that the rate cuts won’t happen at all would not go over well.
As of this writing, both Nvidia and Meta Platforms are up over 50% year-to-date, so investors still have a strong preference for large companies with strong growth outlooks. That said, investment performance did broaden during the quarter – which is usually a good sign. Beyond technology, the energy, financial services, and industrial sectors also had double-digit returns. Only real estate posted a loss.
Japan was by far the best major market last quarter. It rose 19.3% in local terms, but dollar-based investors only saw an 11.2% return due to the depreciation of the yen. Taiwan was the top emerging market at 17.3% (12.5%). Most major foreign markets were in mid-single digits. Overall, foreign stocks gained 5.7% in dollar terms. China was the main drag once again, falling about -2%.3 We try to minimize China exposure in portfolios.
The bond market rally unfortunately didn’t carry over into this quarter. The economy did not weaken as expected and therefore the Federal Reserve didn’t cut interest rates as investors had hoped. The benchmark Bloomberg Aggregate Bond Index fell -0.8%, but it was quite possible (if not downright easy) to beat that return in other areas of the bond market. Short term corporates, convertible bonds, floating rate debt, asset backed securities and private debt all generated positive returns last quarter. Even money market mutual funds earned a return of more than one percent.
The strength in the economy that negatively impacted most bond returns was a nice tailwind for commodities prices. Gold was up over 7.6% last quarter.4 Oil, copper, and uranium also rose on the back of rising industrial demand.
Activity
Since the end of last October, the stock market has been in an uptrend. Five months is a fairly long period to go without even a 5% pull-back. We have been waiting for signs that the market is going to take a breather, so to speak, but we really didn’t see any during the first quarter. Even the January reversal in the bond market (from lower to higher yields) did not prompt a sell-off – even in interest-rate sensitive areas such as homebuilding. Therefore, it was a pretty quiet quarter in terms of portfolio moves. Gold and other alternatives probably intrigue us the most right now because the long-term bond cycle appears to have turned negative.
The forty-year bond bull market appears to have ended in 2021. There were several periods where bonds out-performed stocks during this period, but recent bond performance is looking more like the 1970s.
Outlook
Last quarter this Outlook section said essentially “there are always reasons to be concerned, but staying the course has almost always been the better decision”. That is all still true, but I will confess to being a little less confident in the near term than I was three months ago. The 10%+ advance in the S&P 500 last quarter was considerably more than fundamentals warranted, especially as inflation trends are no longer improving and the Middle East conflict threatens to expand. Oddly enough, the strength of stocks in recent months has largely silenced the naysayers, which actually makes the market riskier. In the absence of macro events like war and recession, markets tend to grind higher over time by scaring people out, then rising as those who have fled ultimately buy back in at higher prices. If there is nobody left trying to get back into the market, who is going to push prices up from here? The next “correction” might have to be deeper than usual in order to shake enough people out of their positions. Again, it will be important to listen to the Federal Reserve. Recent Fed comments about two or fewer rate cuts this year might give stock investors pause.
Commentary – OK, Let’s Talk Foreign Stocks
The performance of foreign stocks versus domestic stocks over the past decade plus is such that many investors could be forgiven for asking, why even bother? I’m not going to make the case for over-weighting foreign stocks. I am, however, going to use charts to show why you do want some foreign stock exposure and why now might not be a bad time to add one’s foreign position.
The chart above shows the massive recent out-performance of U.S. stock over foreign stocks since the great financial crisis (2007-09). In the 35 or so years before this, U.S. and foreign stock performance was very comparable. You should regard the 1984-1989 period as the great Japanese stock bubble, and the following eleven years (1990-2000) as the unwinding of that bubble. Hopefully, future investors will not have to deal with the unwinding of the great American stock bubble.
Below is a chart of global stock market capitalization. U.S. stocks as a percentage of global stock market capitalization has been rising strongly since 2009, and is now at the highest level ever (64%). There are several reasons for this – the strong post-great financial crisis performance of the U.S. economy, the breakout of the technology sector (which is dominated by U.S. firms), and the high degree of fiscal and monetary stimulus in the U.S. relative to the rest of the world. Still, this is kind of shocking.
All of that said, since the United States is just over 4% of the world’s population, how high can we possibly expect this percentage to get? Clearly, Brexit was a negative for the U.K. and Europe, and Xi’s crackdown on Chinese technology companies in 2021 is easy to spot.
It seems like at some point we will see mean reversion here, if for no other reason than the rest of the worst can’t screw up perpetually, can they?
The left chart below shows the valuation discount between the U.S. and the rest of the world. There are several reasons why the U.S. merits a valuation premium to the rest of the world – safe haven status, higher growth rate, the dollar is the world’s reserve currency, among others. Again, has the market pushed this too far? The current discount that foreign stocks trade at versus the U.S is the highest in history. It is quite above the normal discount (in fact it is more than twice the average).
The chart on the right side shows that while U.S. stocks offer greater growth potential, they offer less than half the dividend yield of foreign stocks. Just like with price-earnings multiples, foreign market dividend rates are little changed over the past twenty years. This stands in stark contrast to the U.S. market, where dividend yields have fallen to a paltry 1.4%. The way to read this is that global investors have had very modest expectations of non-U.S. stocks since the late 2000s, so foreign stock prices have only kept pace with the modest profit growth those companies have posted in aggregate. Conversely, led by the technology sector but also bolstered by a robust consumer sector, U.S. stocks have posted tremendous gains since 2009. The U.S. economy did well, but its stocks did even better. Today’s prices don’t just reflect the robust profit growth of the past 15 years but the strong conviction that those superior rates of growth will persist well into the future.
I am not writing this to say that investors are wrong to have bid up U.S. stocks, nor am I saying that investors should anticipate an imminent surge in foreign economies and profits. I am simply stating that all trends end eventually. Sustaining superior performance for a long time is difficult. The New York Yankees had a tremendous run from the mid-1990s through 2001. The New England Patriots went to nine Super Bowls between 2001 and 2019. To some extent, however, the more you win the more you have to spend to keep the winning going. In the U.S. we deficit spend to a degree no other country could afford. Our politics are increasingly divisive, to the extent that sometimes we can’t pass obviously necessary legislation for the sole reason that we don’t want the “other side” to get a “win”. At some point these things will probably catch up with us. U.S. stocks have done very well for quite some time for reasons I think we all understand. At this point, however, foreign stocks trade at a huge discount and they yield far more, so the cost to diversify is close to as low as it ever has been.
[1] Index performance courtesy JPMorgan Guide to the Markets 1st Quarter 2024 ↩︎
[2] JPMorgan Guide to the Markets 1st Quarter 2024 ↩︎
[3] JPMorgan Guide to the Markets 1st Quarter 2024 ↩︎
[4] JPMorgan Guide to the Markets 1st Quarter 2024 ↩︎
DISCLOSURE
Past performance is no assurance of future results. Trademark Financial Management, LLC (“Trademark”) is a registered investment adviser with its principal place of business in the State of Minnesota. Trademark and its representatives are in compliance with registration requirements imposed upon investment advisers by those states in which Trademark operates. Trademark may only transact business in those states in which it is registered or qualifies for an exemption or exclusion from registration. This newsletter is limited to the dissemination of general information pertaining to its investment advisory/management services. Any subsequent, direct communication by Trademark with a prospective client shall be conducted by a representative that is either registered or qualifies for an exemption or exclusion from registration in the state where the prospective client resides. A complete list of all recommendations will be provided if requested for the preceding period of not less than one year. It should not be assumed that recommendations made in the future will be profitable or will equal the performance of the securities in this list. Opinions expressed are those of Trademark Financial Management and are subject to change, not guaranteed and should not be considered recommendations to buy or sell any security. For information pertaining to the registration status of Trademark please contact Trademark at (952) 358-3395 or refer to the Investment Adviser Public Disclosure web site (www.adviserinfo.sec.gov).
For additional information about Trademark, including fees and services, send for our disclosure statement as set forth on Form ADV from us using the contact information herein or by calling 952-358-3395. Please read the disclosure statement carefully before you invest or send money. Any reference to a chart, graph, formula, or software as a source of analysis used by Trademark Financial Management staff is one of many factors used to make investment decisions for your portfolio. No one graph, chart, formula, or software can in and of itself be used to determine which securities to buy or sell, when to buy or sell them, or assist any person in making decisions as to which securities to buy or sell or when to buy or sell them. Any chart, graph, formula, or software used is limited by the data entered and the created parameters. The data was obtained from third parties deemed by the adviser to be reliable. Nonetheless, the adviser has not verified the results and cannot be assured of their accuracy.