Higher interest rates continued into late October, but at that point positive inflation news and encouraging statements from Federal Reserve Chairman Jerome Powell led to a massive “Santa Claus rally” in both stocks and bonds. Treasury Secretary Janet Yellen shifted debt issuance exclusively to short maturity bonds, so without new supply, long term bond demand forced interest rates down sharply. Many sectors that previously struggled with rising rates surged once rates began to decline. In fact, small caps outperformed large caps and real estate outperformed technology last quarter.1 Only the energy sector was lower, as U.S. shale production was so strong that the crisis in the Middle East did not lead to supply disruption fears and gas prices stayed low.
Foreign stocks also benefitted from falling rates in the United States. Lower U.S. bond yields took the pressure off foreign currencies not tied to the dollar. Latin America was especially strong, with both Brazil and Mexico adding more than ten percent.2 India also had a strong quarter and year, probably due to the relative decline of China. European stocks were competitive with U.S. stocks in local currency (Euros primarily), but they trailed badly in dollar terms. Hedging one’s developed market exposure helped – Japan provided returns almost 20%3 higher if the weak yen was hedged back to the dollar.
Bonds behaved like a beach ball released under water. It was obvious to most that when the Federal Reserve let it be known that the interest rate hiking cycle was over, bonds would rally furiously. The hard part, of course, was determining when. Before bonds bottomed out on October 19th they were down close to -4% on the year – confounding those that expected the interest rate peak to occur much earlier in the year. Surprising economic resilience meant the Fed was under very little pressure to cut interest rates, so they could easily wait for inflation to come down on its own (which it finally has). Bonds rallied almost 9% in the last ten weeks of the year to close the year up 5.5%.4
Most commodities (-7.9%) struggled during 2023 as slowing world growth reduced demand. Gold was a modest exception; Gold bullion ETFs rose just under 13% in 2023.
Activity
The most important consideration last quarter was making sure portfolios were as “risk-on” as risk tolerances permitted once interest rates turned lower. This required increasing small cap exposure, which we had under-weighted earlier in the year when high quality was the dominant investment factor. We also increased bond duration, which we had reduced earlier in the year because short term debt was paying 5.25% or more. A 5.25% annual rate is only a little over 1.3% per quarter; when interest rates are plunging bond investment returns can exceed 1.3% in a week. We are still modestly underweight bond duration. Lastly, we sought to be more discriminating in our international exposure. Where appropriate, we used ETFs that targeted India and/or Japan and de-emphasized or omitted China entirely. As U.S. interest rates began to tumble, we exchanged out of some of our currency-hedged exchange traded funds (ETFs) because a falling dollar would no longer be a headwind to foreign stock performance.
Outlook
My experience is that making forecasts just makes one look bad in retrospect. The economy did better and interest rates stayed higher last year than anyone forecasted back in January 2023. This year the markets started out believing there would be six rate cuts in 2024 but they are already backing off from that as employment and retail sales trends continue to be fairly robust.
When I re-read what I and others wrote last year I saw more pessimism than was ultimately warranted. I believe it is okay (if not essential) to identify real and potential market risks ahead of time. The key is not to let them unduly influence you. I was concerned that investors might sell stocks last fall in order to lock in the best short-term rates since 2007, but I also knew that stocks tend to be seasonally strong after Halloween and if the Fed were to hint at being done raising rates, the broad stock market could have a “surprisingly strong rally”.5
The fact is that it is very hard to identify significant market peaks before they happen. One can know that interest rates or unemployment is rising or that stocks are expensive relative to history, but these conditions occur with some frequency without causing major sell-offs. What one cannot predict in advance is a crisis of confidence. Sharp declines occur when existing concerns suddenly coalesce into an overriding crisis narrative which drives investors to sell because they perceive that things are getting worse and that most others feel the same way and are going to respond by selling their shares. This is what is known as the “Doomsday” trade, and financial writer Jared Dillian likens it to “flypaper for idiots”. 6Not that bad things don’t happen, but true crises of confidence happen so infrequently that it is financially harmful to panic every time you hear someone express worry. The world is dealing with a war in Ukraine, another war in Gaza, and countless somewhat lesser provocations (attacks on ships in the Red Sea, the American political system) and despite all that here we are at all-time highs on all major U.S. stock indices. Worry if you want, put 10% in T-bills if it helps you sleep at night, but by all means keep focused on the long term, which is statistically overwhelmingly likely to be positive. Pessimism always sounds smart, but it has a lousy track record.7
Commentary – The Two Economies
I have a theory that there are two types of economies right now. There is the “old” economy, which is made up of all sorts of economically and/or interest rate sensitive companies. These companies grow and contract as the economy does and their growth and stock returns are, therefore, linear (think 2,4,6,8,10 etc.). Taken as a whole, their value rises maybe 4-8% per year. If interest rates fall, the market might push their values up 15-25%. If interest rates rise on the other hand, those stocks may post 5-15% losses, but intrinsically their annual growth averages around 6%. Most companies in the world fall into this category.
Then there is the “new” economy. Today these are the companies that build and maintain “platforms” or “networks”, where the more entities that are attached to it the more it is worth exponentially (think 1,3,6,10,15, etc.) The new economy group includes companies that we have come to call the “Magnificent 7” (Apple, Amazon, Microsoft, Meta, Alphabet, Nvidia, and Tesla) plus the companies that supply them the components they need to keep growing, such as Taiwan Semiconductor, ASML, Broadcom, Adobe, AMD, and several others. They are on what we currently think of as the cutting edge – cloud computing and artificial intelligence (AI). Best of all, they are nearly impervious to overall global economic activity trends and interest rates because investors believe they are the future regardless of whatever else happens.
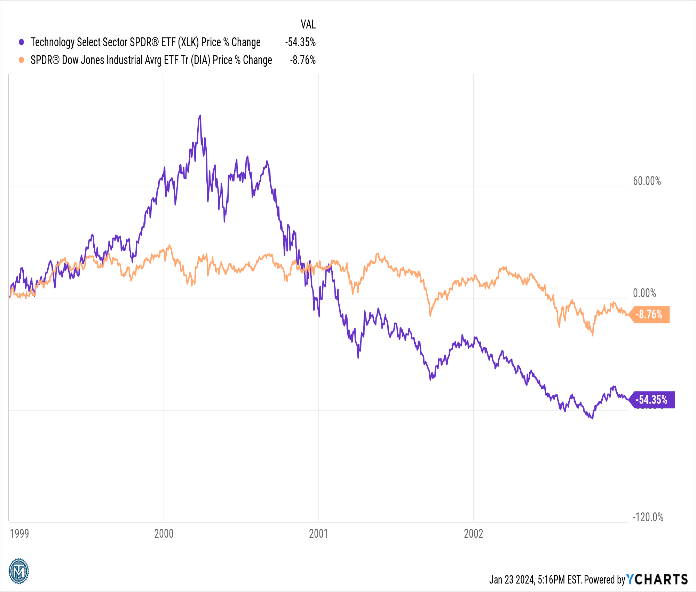
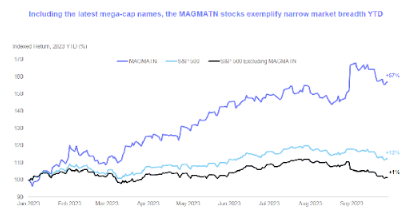
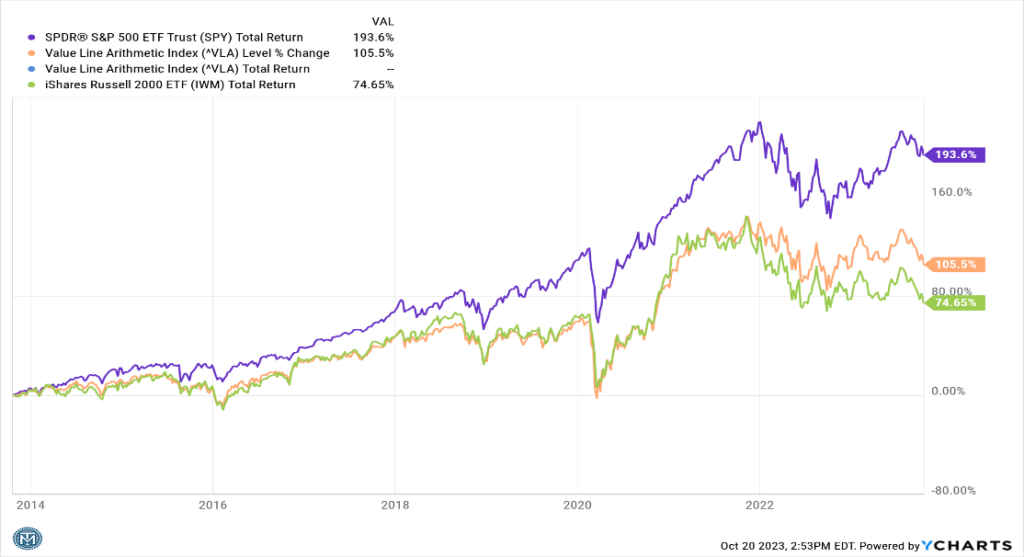
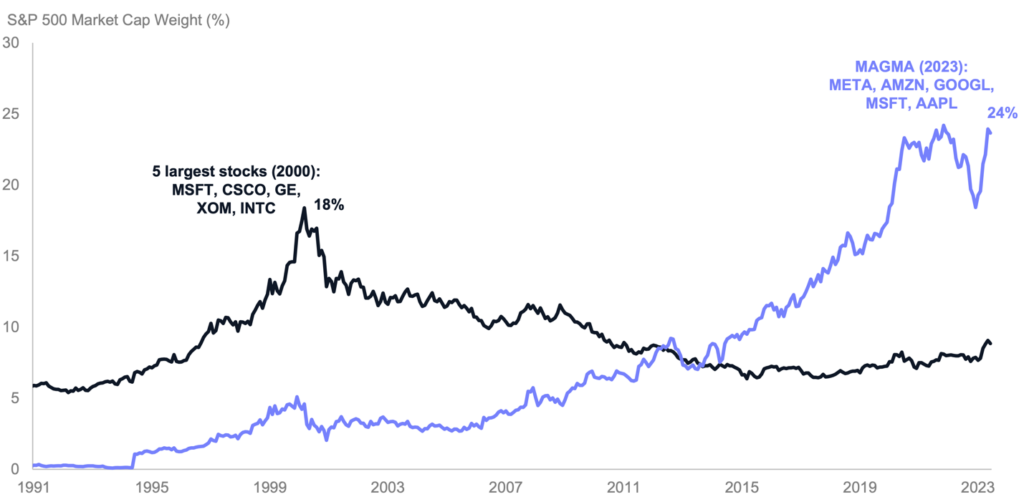
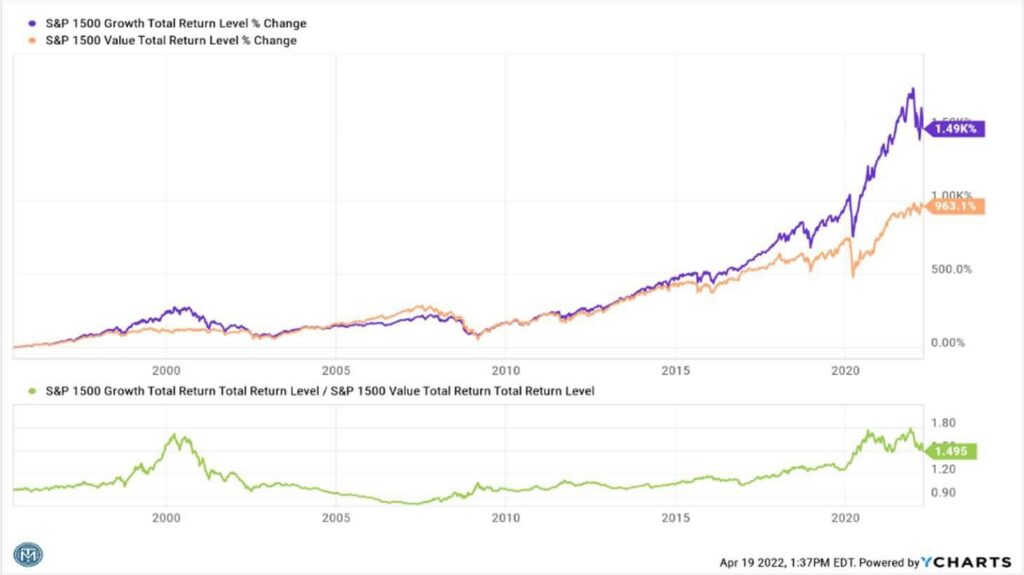
Is this theory true? It doesn’t matter. This is the narrative the stock market trades off of today and has been since roughly 2016 (interrupted briefly by Covid in 2020; see the chart). Investment success has increasingly depended upon how much one has shifted towards new economy stocks. The new economy narrative isn’t original – investors told a similar story in the late 1960s after the transistor was invented and in the late 1990s when the commercial internet was born. The narrative typically ends when the growth rate of the new economy stocks converges (downward) with the growth rate of the average company.8 As the chart shows, there are long periods of time after the narrative is broken in which all stocks trade as if growth is linear. Technology crashed over 80% between March 2000 and October 2002 and was not a leading sector again for over a decade.
Technology has been very strong in recent years, but it lagged the average sector for over half of the last twenty years even after the crash.
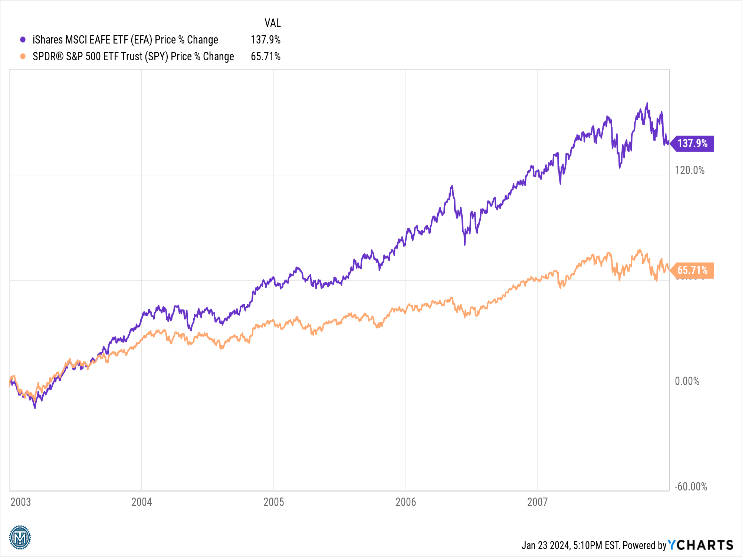
If you wonder why the U.S. has out-performed foreign markets so dramatically since 2013 or so, the biggest reason is the percentage exposure of the U.S. market to technology (over 30%) versus the average foreign market’s technology exposure (less than 10%). As the chart below shows, European stocks outperformed by roughly 72% in a decade where technology languished. Two other major factors for U.S. out-performance were the much lower cost of energy in the U.S. due to the shale revolution and the strength of the U.S. dollar relative to other currencies.9
Foreign stocks don’t always underperform. They substantially outperformed the U.S. during the mid-2000s when industrial and financial stocks took over after the dot com crash.
There is no guarantee that new economy stocks will continue to provide substantially better returns going forward; in fact, the more they rise the harder this becomes. Technology stocks represent 30.8% of the U.S. market today, according to Standard & Poor’s. Add Amazon (3.5%), Alphabet (3.9%), and Meta (2.1%) each of which are not considered technology10, and the total exceeds 40%. I believe that this is not sustainable. There are natural limits. For example, a company growing at 6% per year cannot boost its tech spending by 50% annually for very long before running out of money.
I believe we are in a market being driven by a new economy narrative and as long as that lasts, this narrow yet important group of stocks is going to generate superior returns. I don’t know how close we are to the end of this particular chapter of the technology bull market, but having managed money through the “dot com crash”, I know that I don’t want to get caught “holding the bag” so to speak. Tech stock had a 33% “correction” from January 4th to October 14th, 2022 and we look at that now as a blip. When the narrative finally collapses (and it might be from much higher levels than today), history suggests the decline will be well over 50%. That is the kind of loss one has a hard time coming back from, and one which we feel is our primary job to avoid. Investors need to have exposure to Microsoft11 and Nvidia and the others because they are driving the economy of the future (as we see the future today), but they also need to own companies like McDonalds, Visa, Berkshire Hathaway, and Costco. These companies, while perhaps not as exciting, have proven to be very reliable over time. We want to make sure our portfolios balance the timely with the enduring.
[1] From strategasrp.com, Real Estate gained 18.8% versus Technology’s 17.2% return. Energy lost 6.9%. The S&P small cap 600 Index outgained the S&P 500 15.1% to 11.7%. ↩︎
[2] Foreign index performance also courtesy of strategasrp.com. ↩︎
[3] The differential between the hedged Japanese stock index ETF (DXJ) and the unhedged version (EWJ). ↩︎
[4] JPMorgan Guide to the Markets 2023, page 33. ↩︎
[5] Outlook section, Trademark 3Q23 Quarterly Market Commentary. ↩︎
[6] Jared Dillian in The 10th Man, November 24, 2023 ↩︎
[7] In The Psychology of Money, author Morgan Housel writes that we respond better to financial pessimism because optimism sounds like a sales pitch while pessimism sounds like someone trying to give you a helpful warning. ↩︎
[8] The narrative was beginning to burst in 2022 on surprisingly poor earnings reports from five of the Mag 7, but it was re-invigorated with a vengeance when OpenAI initiated the Artificial Intelligence mania last January. ↩︎
[9] For dollar-based investors. In local currency terms, the performance gap was much smaller. ↩︎
[10] Amazon is a consumer cyclical (retail) stock, and both Alphabet (Google) and Meta (Facebook) are in the communications services industry. ↩︎
[11] Microsoft, for instance, lost more than 2/3 of its value between March 2000 and March 2009. ↩︎
DISCLOSURE
Past performance is no assurance of future results. Trademark Financial Management, LLC (“Trademark”) is a registered investment adviser with its principal place of business in the State of Minnesota. Trademark and its representatives are in compliance with registration requirements imposed upon investment advisers by those states in which Trademark operates. Trademark may only transact business in those states in which it is registered or qualifies for an exemption or exclusion from registration. This newsletter is limited to the dissemination of general information pertaining to its investment advisory/management services. Any subsequent, direct communication by Trademark with a prospective client shall be conducted by a representative that is either registered or qualifies for an exemption or exclusion from registration in the state where the prospective client resides. A complete list of all recommendations will be provided if requested for the preceding period of not less than one year. It should not be assumed that recommendations made in the future will be profitable or will equal the performance of the securities in this list. Opinions expressed are those of Trademark Financial Management and are subject to change, not guaranteed and should not be considered recommendations to buy or sell any security. For information pertaining to the registration status of Trademark please contact Trademark at (952) 358-3395 or refer to the Investment Adviser Public Disclosure web site (www.adviserinfo.sec.gov).
For additional information about Trademark, including fees and services, send for our disclosure statement as set forth on Form ADV from us using the contact information herein or by calling 952-358-3395. Please read the disclosure statement carefully before you invest or send money. Any reference to a chart, graph, formula, or software as a source of analysis used by Trademark Financial Management staff is one of many factors used to make investment decisions for your portfolio. No one graph, chart, formula, or software can in and of itself be used to determine which securities to buy or sell, when to buy or sell them, or assist any person in making decisions as to which securities to buy or sell or when to buy or sell them. Any chart, graph, formula, or software used is limited by the data entered and the created parameters. The data was obtained from third parties deemed by the adviser to be reliable. Nonetheless, the adviser has not verified the results and cannot be assured of their accuracy.
Summary
The stock market rally ran into the wall of higher interest rates at the beginning of August. As a result, the market gave up their July gains and posted a -3.3%1 loss for the quarter. This was the first quarterly decline since the third quarter of 2022. Given the sharp upward turn in rates, the stock decline was actually rather modest; if investors truly believed the Federal Reserve would keep rates around 5.5% for the foreseeable future the decline probably would have been much worse. In other words, interest rates are driving the stock market right now, and not in a good way. The bond market also slipped into negative territory in aggregate last quarter, though many sub-sectors remained positive. As higher interest rates tend to compress earnings multiples, the high-flying NASDAQ gave back more (-3.9%) than the stodgier Dow Jones Industrial Average (-2.1%). That said, NASDAQ remains far ahead year-to-date. Unfortunately for small cap stocks, returns in this area (-5.2%) continued to trail all other domestic indices. Investors continue to favor larger, more profitable, and less leveraged companies.
International stocks also declined last quarter. Most foreign economies did not have the economic bounce in the third quarter that the U.S. did, so they didn’t see earnings estimates rise as much. Developed foreign economies were off -4.1%2 while emerging markets dropped -2.9%. India was a bright spot for emerging markets. Small company stocks in emerging markets did much better than larger ones; they recorded a surprising 2.9% gain. EM companies that focused on domestic demand did quite a bit better than those that rely on exports.
Bonds had another rough quarter. I’m going go into detail on the bond market in the Commentary section, so I will just say for now that last quarter’s -3.2%3 return wiped out all the year-to-date gain for the index. Nevertheless, several sectors posted a gain last quarter and are largely sidestepping the ongoing rout at the longer end of the high-grade market. 3-month T-bill yields are approaching 5.5% right now so money market yields are proving a strong alternative to bonds.
In terms of alternatives, gold also declined last quarter (-3.7%; don’t let anybody tell you that gold is an inflation hedge4). Since the dollar was strong due to America’s relative economic strength, gold went down in dollar terms. Real estate continues to be hurt by rising interest rates, but oil price gains led commodities higher.
Activity
The story of 2023 was supposed to be falling interest rates as the U.S. economy cooled, and strong foreign markets as the cooling U.S. economy dragged down the dollar. This is how the first quarter began, and that is how we positioned portfolios back then. However, by May that scenario had begun to collapse. The U.S. economy did not slow down, the Federal Reserve continued to hike interest rates, and foreign currencies slumped. All one can do is try to be among the first to recognize when the consensus forecast is wrong and update portfolio under- and over-weights accordingly. We believe that we did a very good job of reducing interest rate exposure on the bond side and underweighting income-oriented industries (utilities, real estate, etc.) on the stock side. We didn’t overweight technology as much as we might have because that industry historically suffers when interest rates are high. Just about all of the trades we made in September, and so far in October, have been designed to collect more current income (short term, floating rate bonds) or reduce net exposure to the high return sectors that would be high loss if bond yields keep rising.
Thought Experiment
If you want to understand the impact of higher interest rates on stocks, here is a thought experiment. Suppose there were three investors, Mr. Optimist, Ms. Practical, and Mr. Pessimist. They all have money in the stock market. Mr. Optimist hopes for 12% per year, Ms. Realist would be happy with 8% or 9%, and Mr. Pessimist says he’d be lucky to get 5%. Every so often Mr. Treasury Bill comes along and makes them an offer of a guaranteed return. The offer is usually around 2%, but sometimes the offer is as low as 1% and other times as high as 3%. Either way, the three investors always turn Mr. Treasury Bill down. In January, however, he offered them 4% guaranteed. Mr. Pessimist was sorely tempted – after all, 2022 was a bad year for stocks. When Mr. Treasury Bill came back in April offering 4.5%, Mr. Pessimist sold his stock and accepted the deal. “Maybe I’m getting a little less that I wanted”, he reasoned, “but I’m getting a guarantee”. He sold his stock. Mr. Treasury Bill came back again in July offering 5%, and now he is offering 5.5%. Ms. Practical is weighing the offer carefully. “You don’t often get the chance to lock in a yield this good”. The “Mr. Pessimists” are out of the market now. If the “Ms. Practical” out there begin selling…
Outlook
Simply put, interest rates are driving the financial markets. As long as they continue to rise, most stocks are going lower. Seasonally, however, markets tend to bottom out in October and post gains from October’s lows through the end of the year. I feel confident that when interest rates finally peak due to economic weakness and begin to head lower, we could see a surprisingly strong stock rally. I just don’t know how close we are to that “when”.
Source: Goldman Sachs Asset Management
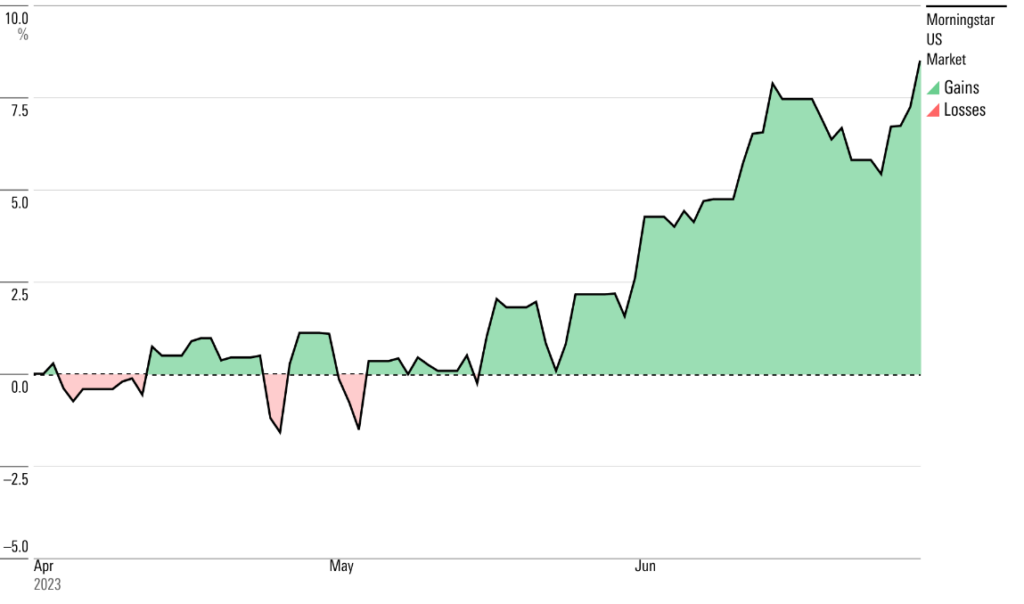
I included this chart to show how well the biggest seven5 stocks have performed relative to the rest of the market. In the past when I have pointed out this discrepancy the point was to focus on the high and ultimately unsupportable valuation of that handful of technology-related stocks. Today I would prefer to focus on the other 493 stocks and how inexpensive all but maybe 15-20 of them have become. Additionally, I’d like to focus on how cheap stocks smaller than the top 500 are. Below is a ten-year chart of the U.S. stock market again separating large stocks, all stocks equally, and small stocks. Small stocks posted a 10-year compound return of 5.7345%. All stocks equally-weighted have a ten-year compound return of 7.5363%. There is no sense that the vast majority of stocks need some time to “cool down” after a strong decade of performance.6 The broad market is trading at February 2021 levels, while small caps have done almost nothing since August of 2018.
There are some very good reasons why smaller companies have under-performed, most having to do with lower profitability and higher interest costs. That said, there is a point in the business cycle where interest rates are falling in response to economic weakness and investors anticipate lower rates will stimulate demand. Early-to-midway through an economic recovery, almost all companies are profitable. In the interval between the anticipation of an economic recovery and the actual economic recovery, small cap stocks often more than double (2003-2006, 2009-2011, late March 2020 to early November 2021). I don’t know when the next cycle will begin, but the potential returns offered by the broader market, and small caps in particular, are very exciting.
Commentary
Since I have written a lot in this Quarterly Report about how important interest rates are, I’m going to devote the Commentary section to bonds and how they work. At their most basic level bonds are a contract between a borrower and a lender in which the borrower receives a sum of money and the lender receives a promise to repay the money plus an additional amount periodically to compensate them for two risks: 1) the risk that the principal when returned will have less purchasing power due to inflation than it did when the loan was made; and 2) the risk that the borrower is unable to pay back the full amount borrowed. The former is known as inflation or interest rate risk, and the latter is called default or credit risk. Today, let’s focus on interest rate risk.
If I buy a 5-year bond (in other words, make a loan) that yields me 4%, I’m going to receive $40 per year for every $1000 I invest. Let’s say one year later interest rates fall to 3%. Somebody wanting to buy a bond similar to mine at that point would only receive $30 per $1,000. If they saw that I was receiving $40, they might ask to buy my bond. I would sell that bond for more than $1,000 because I can’t get the same interest today as I could one year ago. Let’s say in year two interest rates go to 5%. I feel bad because I’m only getting $40 per year whereas a new issue buyer could get $50. If I go to sell my bond in order to buy the higher yielding bond, the buyer will not give me $1,000 because she would be losing out on $10 of income per year. Simply put, when interest rates go up, bond prices go down and when interest rates go down bond prices go up.7
Typically, the longer the time frame until a bond matures the greater inflation risk the buyer takes, so the more interest he expects to receive. Generally, two-year bonds yield less than five-year bonds which yield less in turn than thirty-year bonds, so a graph that represents bond yields over time is typically upward-sloping. That said, there are times when this relationship does not hold true. Today the Federal Reserve is holding short term interest rates unusually high in order to fight inflation. The bond market expects rates to begin to decline next year, so five- and thirty-year bonds yield less than two-year bonds. This is called an inversion. Inversions are usually regarded as signaling distress in the economy.
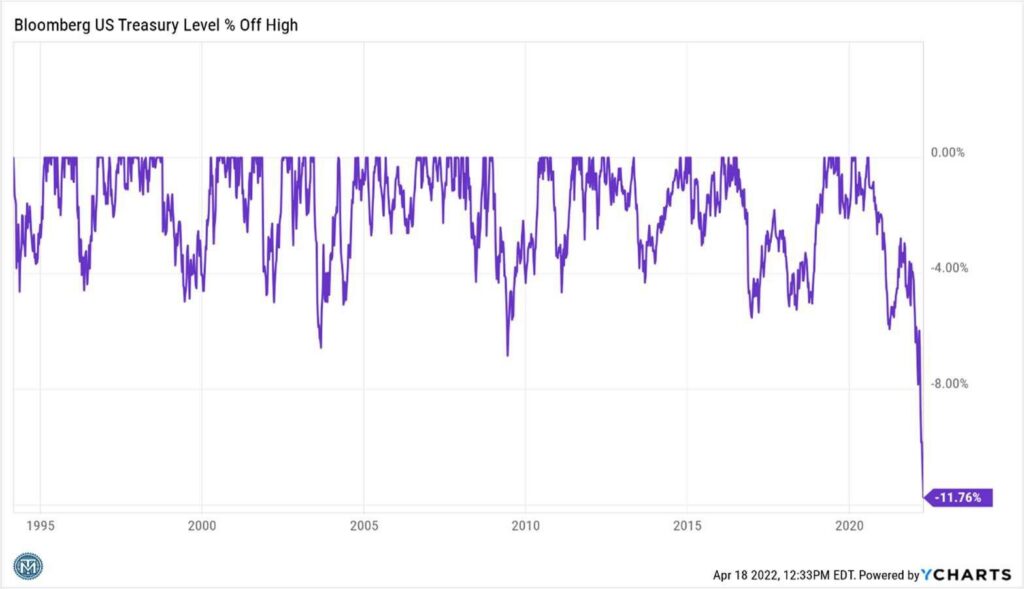
Under normal circumstances, the distress will play out promptly in the form of a recession, which will squash inflationary pressures and eventually allow the Federal Reserve to start lowering interest rates to stimulate the economy once again. So far in 2023 the distress has not been acute enough to cause a recession (perhaps because all of the monetary stimulus put into the system as a result of Covid shutdowns). In any event, interest rates have soared over the past two years such that bond investors have been crushed (unless they owned bonds have been short enough in duration that they matured before their future value could decline). Remember, if starting yields are low enough (ten-year bonds yielded around 1% at the beginning of 2021) and duration is high enough (7 years or so), bond yields rising from 1% to 5% over three years means you lose 25% (3 years of 1% interest) minus (4% higher yields times duration of 7; 3%-28%=-25%). Ouch.
This is a bigger loss than bond investors experienced at any point in the 1970s, because starting yields in the 1970s were much higher and therefore durations were somewhat lower. In fact, I’ve heard that the only worse period for U.S. bond investors was the late 1780s. Nobody’s retirement income projections planned for a 25% loss in bonds – it had never happened before in the modern financial era. That does not mean that it was unforeseeable. Longer term interest rates on the United States average closer to 4%. If one bought a bond in 2012 or 2016 or 2020 at a yield of less than 2%, one should have been aware of the loss potential if yields “normalized”. Mitigating loss potential would have involved underweighting duration and/or shifting a meaningful portfolio of one’s bond exposure to alternatives. We did both of these.
There are a couple of inferences I hope you will get from this Commentary:
• In bonds, low yields lead to low future returns. When the Fed forced interest rates below 2% after the Great Financial Crisis (2007-09), they created a bond market “bubble” that was going to pop at some point when yields came back to normal levels.8
• Bond yields are much higher now. Therefore, future bonds returns will probably be much better than they have been over the past 10-15 years. The math9 is much better for bonds today even if rates go higher since coupon rates are now high and duration is lower.
• Investors tend to see the recent past very clearly and the distant past very poorly, so they tend to position themselves to fight the last war and not the next one. The Fed tends to respond to investor fears even when they should know better.
It is hard to state how difficult it was to be a bond investor over the past decade, knowing that Federal Reserve policy meant that investors were being systematically underpaid for inflation risk. Today that is not the case. Many if not most sophisticated investors will tell you that bonds are more attractive than stocks today on a risk-adjusted basis, because bond prices fully reflect the new interest rate reality while many (larger) stocks still trade as if borrowing costs are going back to three or four percent. We anticipate shifting towards higher bond weightings in 2024, but we are always going to be nimble enough of thought to change our opinion if conditions warrant.
[1] Performance information from Standard & Poors, NASDAQ, and Dow Jones through NEPC. ↩︎
[2] Foreign market performance information from MSCI International through NEPC. ↩︎
[3] Bond performance from Bloomberg through NEPC. Gold performance through NEPC ↩︎
[4] Gold is a hedge against currency depreciation. If the dollar is strong, gold is not going to gain in dollar terms. ↩︎
[5] MAGMATN is Microsoft, Apple, Google (Alphabet), Meta (Facebook), Amazon, Tesla, and Nvidia. ↩︎
[6] It’s not like they were all that strong in the preceding decade (2001 to 2011) either. ↩︎
[7] If you want to get deeper into the mathematics of bonds, duration is a formula which calculates the principal gain or loss of a bond given a 1% change in its yield. The inputs are the bond’s coupon payments and the length of time to its maturity. A duration of 3 means that the bond’s price will change 3% for a 1% change in interest rates. The lower the coupon rate of the bonds and the greater the time until maturity (when you receive your principal back), the higher the duration. Higher duration bonds give you more total return than low duration bonds when interest rates fall, but when the rise higher duration bonds lose more. ↩︎
[8] The bond market tried in 2013 and 2018 to “slow leak” yields upward to avoid the pop that we eventually began to get in 2021, but the Fed capitulated both times to whining stock investors. ↩︎
[9] A 4% gain in yields over three years would produce a 9% loss (3 years times 5% coupon or 15%) minus (4 years times duration of 6 years or 24%). Duration is lower today because higher bond coupon payments mean more money (interest) comes back to the lender sooner. ↩︎
Disclosure
Past performance is no assurance of future results. Trademark Financial Management, LLC (“Trademark”) is a registered investment adviser with its principal place of business in the State of Minnesota. Trademark and its representatives are in compliance with registration requirements imposed upon investment advisers by those states in which Trademark operates. Trademark may only transact business in those states in which it is registered or qualifies for an exemption or exclusion from registration. This newsletter is limited to the dissemination of general information pertaining to its investment advisory/management services. Any subsequent, direct communication by Trademark with a prospective client shall be conducted by a representative that is either registered or qualifies for an exemption or exclusion from registration in the state where the prospective client resides. A complete list of all recommendations will be provided if requested for the preceding period of not less than one year. It should not be assumed that recommendations made in the future will be profitable or will equal the performance of the securities in this list. Opinions expressed are those of Trademark Financial Management and are subject to change, not guaranteed and should not be considered recommendations to buy or sell any security. For information pertaining to the registration status of Trademark please contact Trademark at (952) 358-3395 or refer to the Investment Adviser Public Disclosure web site (www.adviserinfo.sec.gov).
For information pertaining to the registration status of Trademark please contact Trademark at (952) 358-3395 or refer to the Investment Adviser Public Disclosure web site (www.adviserinfo.sec.gov). For additional information about Trademark, including fees and services, send for our disclosure statement as set forth on Form ADV from us using the contact information herein or by calling 952-358-3395. Please read the disclosure statement carefully before you invest or send money. Any reference to a chart, graph, formula, or software as a source of analysis used by Trademark Financial Management staff is one of many factors used to make investment decisions for your portfolio. No one graph, chart, formula, or software can in and of itself be used to determine which securities to buy or sell, when to buy or sell them, or assist any person in making decisions as to which securities to buy or sell or when to buy or sell them. Any chart, graph, formula, or software used is limited by the data entered and the created parameters. The data was obtained from third parties deemed by the adviser to be reliable. Nonetheless, the adviser has not verified the results and cannot be assured of their accuracy.
Schwab Transition
In 2020, our custodian, TD Ameritrade, was acquired by the Charles Schwab Corporation. Over the past several years, the two companies have put tremendous thought and resources into planning and preparing for the transition of TD Ameritrade clients over to Schwab’s custody and technology platforms. The final transition is scheduled for the first weekend in September 2023 (Labor Day weekend), at which time all your accounts will be transitioned from TD Ameritrade to Schwab. At that time, you will receive new Schwab-based account numbers for the accounts we manage. We are happy to report that you will not need to sign any new paperwork. The Schwab and TD Ameritrade teams have worked hard to make this transition as smooth as possible. In these coming months, you should expect to receive more communication from Schwab, TD Ameritrade, and Trademark regarding the transition. Please feel free to contact us at any time if you have questions.
Summary
The second quarter of 2023 was not that different from the first quarter. Stocks continued to surge despite forecasts of recession and a hawkish Federal Reserve because investors continued to believe that any economic downturn would be milder than predicted. First, April brought better than expected corporate earnings announcements. Then, May brought news that unemployment was holding steady in the 3.6%-3.7% range while the tide of inflation continued to recede. When the news is better than what is priced into stocks and there is a great deal of money parked in money market funds because of 2022’s volatility, this “recipe” produces higher prices as investors rush to get back in.
U.S. Stock Market Performance, 2Q23
If the story of the first quarter was the unveiling of ChatGPT and the artificial intelligence (AI) mania it unleashed, the story of the second quarter was semiconductor chip maker Nvidia’s profit announcement on May 24th, in which profit guidance tripled. For AI stocks, this added gasoline to the fire. The NASDAQ, where most of such companies reside, rose 13.07%1 during the quarter. The S&P 500, increasingly a technology index, rose 8.74%. The average company rose only 3.87%, however2 (most companies are not, strictly speaking, technology companies). The small stock-oriented Russell 2000 gained 5.21%. The Dow Jones Industrial Average rose 3.89%. The underperformance on the part of large tech stocks in 2022 was fully recovered by quarter end; both they and the slower growing, high dividend stocks of the Dow were roughly 12% below their year-end 2021 levels at quarter end3.
International stocks did far less well in the second quarter than they did in the first. Foreign stocks prefer a weaker U.S. dollar and low inflation, and they got neither. Still, with recession largely avoided thus far and the hope for interest rates to come down later this year, foreign markets added 2.95%4 last quarter. Japan led the way in developed markets with a 7.24% gain; the global move to technology and robotics plays into their strength. On the emerging market side, while the index itself gained only 0.90%, Latin America roared ahead 14.05%. Latin American central banks have been the first in the world to see inflation fall enough to begin cutting interest rates. Asia ex-Japan lost -1.26% on the disappointing (so far) recovery in China.
As a whole, bonds lost money during the second quarter. Their -0.84%5 decline reflected the fact that the economy has not slowed as much as forecast and as a result, the Federal Reserve is still raising interest rates. Of course, the bond market is as diversified as the stock market is, so certain types of bonds gained in value last quarter. Both ex-U.S. developed market bonds and emerging market bonds rose last quarter, as did U.S. corporate high yield bonds and floating rate debt. The key was to take on credit risk but not interest rate risk. Default risk fell during the quarter, but interest rate risk did not. One could have avoided both types of risk and earned 1.22% in short term T-bills.
Activity
As the economic data came in during the quarter that continued to show that economy was not in fact on the cusp of recession, risk appetites grew, and we needed to nudge portfolios away from the defensive, dividend-oriented value funds that we started the year with. We increased exposure to cyclical and growth sectors with the proceeds from value fund sales and from cash, which had built up somewhat last year. We have also sold most positions that are “market neutral,” meaning they aim to provide single-digit returns no matter what the overall stock market is doing by using arbitrage, options, or some other hedge-type strategy. They were attractive in 2022, but by late-May it was becoming obvious that hedging was not going to be necessary.
Outlook
Three months ago I was tentatively optimistic that we could have a pretty good year despite the threat of recession looming, because investor sentiment was weaker than it objectively should have been6. Today, with stocks being roughly ten percentage points higher, I feel we have mostly played out the “sentiment reversal” trade, such that future gains are going to be harder to come by. I believe momentum and positive inflation news will carry us for maybe another month or so, but September is seasonally rough7, and year-over-year inflation comparisons start getting tougher by autumn. The stock market has already digested the likelihood of a 0.25% interest rate hike on July 26, but it expects that bump to be the last one. If it begins to look like they will hike again in September, we could have some turbulence. The key for markets going forward is maintaining the current “not-too-hot, not-too-cold” environment where unemployment stays below 4% but prices and wage growth are closer to 3% than 4%. Again, I think we can do that in the short run.
Commentary – The S&P 500 is a Bad Benchmark
This Commentary is sub-titled, “How come the S&P 500 is up 15% and I’m only up 8%?” The answer to this question goes to the nature of the S&P 500 as a benchmark. A benchmark is designed to represent what percentage return an average investor in a particular asset category should have expected to receive. Therefore, it obviously follows, the benchmark should be broad enough to cover most of the asset category it is supposed to represent, and it should be investable – meaning the benchmark return was achievable through easily purchased securities. For these reasons, benchmark makers (Standard & Poors, Dow Jones, Bloomberg, etc.) make adjustments to a simple size-weighted model. Stocks that are hard to purchase because fewer shares trade are usually excluded from benchmarks, as are companies with dual share classes.8
Over the years, some benchmarks have proven to be less than ideal because of structural changes. For example, in 1990 Japanese stocks were the lion’s share of the international stock benchmark (MSCI). Before the Japanese asset bubble burst, this international index owned more Japanese stocks than all the other non-U.S. countries combined. Almost all active international managers under-performed the benchmarks from 1985 through 1989. After the Japanese bubble burst, international fund managers routinely outperformed the benchmark by underweighting Japan. This worked for about 25 years. U.S. investors experienced a similar situation during the dot.com bubble. The initial public offering of Netscape in 1995 (think AOL) sparked a mania that lasted until March of 2000. The S&P 500 was brutal to try to beat between 1995 and 1999, then surprisingly easy to beat from 2000 to 2008 as over-ownership of tech stocks was bled out of the market. The question you might be asking at this point is, how do prices get so out of line?
The S&P 500 is the most widely accepted benchmark because it covers more than 85% of the U.S. stock market capitalization, which is dramatically more than the Dow Jones Industrial Average does with just its 30 stocks. That said, from time to time a narrative arises that the future belongs to a handful of companies that are at the forefront of where the world is headed. As recently as June 30th, the top 5 U.S. stocks accounted for approximately 24% of the S&P 500’s value and the other 495 stocks accounted for the remaining 76%.9 The last time a small group dominated this much was 1999 just prior to the dot.com bubble bursting See Item 1 below.
Item 1: Market Concentration
I was fortunate enough to have attended a lecture by NYU Business School professor Aswath Damodaran four years ago in which he discussed the sky-high valuations of Tesla and other market favorites. He argued that each company is valued both on what it is as a business and also on what it might become. Very little of the value of McDonalds or Waste Management is based on what they might become, but a considerable amount of Tesla’s value is tied up in what technologies Elon Musk may pioneer in the future. Nvidia’s current value places a very high premium on what artificial intelligence will ultimately achieve. All of this is fine, but there is a certain risk to valuing a company on what it might become. It might never fulfill its potential, either because of management missteps, the emergence of a superior competitor or technology, or because the opportunity itself was never that great. Even when you are right about the long term you can be very wrong in the short term – Microsoft stock fell over 72% between the end of 1999 and the end of February 2009; Tesla over 73% from November 4, 2021 to January 3, 2023. Stock with this kind of volatility should be components in a portfolio, but not the bulk of portfolios.
The S&P 500 equal weighted Index was up 3.83% last quarter and 6.71% year-to-date. I do not argue that you should have just as much Alaska Air or Ralph Lauren or Hasbro 10 in your portfolio as you do Apple or Amazon, but I know you cannot run an economy on technology alone.
A benchmark can be a useful guide to performance, but it should not push you into making unwise investment decisions. The Standard & Poors 500 Index reflects the weighted investment performance of 500 of the largest U.S. companies, but it does not tell you how you should personally be positioned. Increasingly it is the default investing option for those who don’t have the time or discernment to look into market fundamentals. A popularity contest if you will. Inevitably, some of today’s most favored stocks will become tomorrow’s beehive hairdos or parachute pants.
When we put together the core of an investment portfolio, we want future growth potential for sure, but we also want some stability and predictability as well. Mostly we want companies whose products and services are not going to be obsolete in five or ten years, and whose cash flow generation is more steady than episodic. That is why we diversify even when concentrating one’s assets in one area would have generated a greater return. One witticism about diversification, the idea that spreading out one’s assets into different, less-correlated baskets reduces risk, is that “Diversification means always having to say you’re sorry.”11 It also means never having to say “Sorry about your retirement funds. You’ll have to go back to work.”12
[1] Per Morningstar workstation, as is the information on the Dow and S&P 500. ↩︎
[2] According to the S&P 500 equal weighted index ↩︎
[4] All foreign performance information per MSCI via Morningstar Workstation ↩︎
[5] All bond performance information per Bloomberg via Morningstar Workstation ↩︎
[6] Though I did say that one shouldn’t get too aggressive. ↩︎
[7] September has the worst average return of any month over the last ten and twenty years, according to tradethatswing.com ↩︎
[8] A dual share class structure gives a certain class stock greater voting rights than others. ↩︎
[9] For more on this see Barron’s Magazine, July 10, 2023 “The S&P 500 is Now a Tech Fund” by Lauren Foster. ↩︎
[10] All three found in the bottom dozen or so stocks in the S&P 500. ↩︎
[11] Brian Portnoy, Forbes Magazine, March 9, 2015. ↩︎
[12] Diversification does not guarantee investment returns and does not eliminate the risk of loss. Diversification among investment options and asset classes may help to reduce overall volatility. ↩︎
DISCLOSURE
Past performance is no assurance of future results. Trademark Financial Management, LLC (“Trademark”) is a registered investment adviser with its principal place of business in the State of Minnesota. Trademark and its representatives are in compliance with registration requirements imposed upon investment advisers by those states in which Trademark operates. Trademark may only transact business in those states in which it is registered or qualifies for an exemption or exclusion from registration. This newsletter is limited to the dissemination of general information pertaining to its investment advisory/management services. Any subsequent, direct communication by Trademark with a prospective client shall be conducted by a representative that is either registered or qualifies for an exemption or exclusion from registration in the state where the prospective client resides. A complete list of all recommendations will be provided if requested for the preceding period of not less than one year. It should not be assumed that recommendations made in the future will be profitable or will equal the performance of the securities in this list. Opinions expressed are those of Trademark Financial Management and are subject to change, not guaranteed and should not be considered recommendations to buy or sell any security. For information pertaining to the registration status of Trademark please contact Trademark at (952) 358-3395 or refer to the Investment Adviser Public Disclosure web site (www.adviserinfo.sec.gov).
For additional information about Trademark, including fees and services, send for our disclosure statement as set forth on Form ADV from us using the contact information herein or by calling 952-358-3395. Please read the disclosure statement carefully before you invest or send money. Any reference to a chart, graph, formula, or software as a source of analysis used by Trademark Financial Management staff is one of many factors used to make investment decisions for your portfolio. No one graph, chart, formula, or software can in and of itself be used to determine which securities to buy or sell, when to buy or sell them, or assist any person in making decisions as to which securities to buy or sell or when to buy or sell them. Any chart, graph, formula, or software used is limited by the data entered and the created parameters. The data was obtained from third parties deemed by the adviser to be reliable. Nonetheless, the adviser has not verified the results and cannot be assured of their accuracy.
Summary
The markets experienced as much volatility last quarter as we normally see in a full year, but it was mostly to the upside. Several of 2022’s most underperforming assets saw a remarkable comeback, most notably bonds and technology stocks. Largely this was a result of investors’ willingness to overlook persistent short-term inflation and the Federal Reserve’s determination to rein in that inflation whatever that may cost. Many investment professionals believe the Fed should stop raising rates as it is now clear that at least some banks were not able to successfully navigate the 475 basis-point (4.75%) of increases we’ve already had. Additional rate hikes risk making this situation even worse.
U.S equities rose 7.18% last quarter. The average S&P 500 stock rose just 2.93% but the market cap-weighted index was pulled higher by a handful of technology stocks like Meta and Nvidia. The Nasdaq composite soared 17.05%! Much of this occurred in the last three weeks of the quarter as the market figured that the crisis in the financial sector meant the Federal Reserve had to pause. The Fed, as it turned out, thought otherwise. The money that went to technology tended to come out of three main sectors. One obviously was financial stocks after Silicon Valley Bank collapsed. Financials lost -2.27% last quarter, but that was still better than both the energy (falling oil prices, -4.37%) and the utilities sectors (-3.12%).
International developed markets outperformed the U.S. market. MSCI EAFE recorded an 8.02% quarterly gain. Breaking this down, Europe led the way with a 10.56% return, helped by cheaper relative valuations, lower-than-feared energy costs, and the return to a positive interest rate environment. Japan rose 6.19%, led by the appointment of a new leader of the Bank of Japan. Emerging markets rose just 3.96%. China’s re-opening is expected to provide a boost to the rest of Asia and to Latin America, but we really didn’t see much of that last quarter and we might not until later this year.
Bond yields declined last quarter on hopes that the Federal Reserve would adopt a more dovish policy in the wake of the banking crisis. The U.S. bond index finished 2.96% higher, slightly less than high yield’s 3.66% increase. Even short-term bonds were able to add 1.28%. Foreign bonds were aided by a modestly weaker dollar and slightly better-than-expected economic conditions.
Commodities fell more than -3% last quarter, depending on the basket used. Falling energy prices were largely responsible. Gold, on the other hand, rose just under 8%. There are a number of possible explanations, including financial fears tied to the banking situation or perhaps concern about the coming debt ceiling circus negotiations.
Activity
Perhaps surprisingly, given the degree of volatility last quarter, we actually made very few adjustments. The more prices move back and forth, the easier it is to believe that any individual surge or drop is noise and not an important signal. For example, a dollar invested in the Nasdaq three years ago would have grown to $2.05 by year-end 2021 only to fall below $1.35 in both October and December of last year. It’s just under $1.65 today. In the context of January 2022 $1.65 seems cheap (as it is almost 20% lower than $2.05), but in the context of the 65% gain from April 2020 it still seems quite expensive. We believe we are in a “sideways” market right now, so we are not inclined in most cases to buy areas showing relative strength; we just don’t think the strength will last.
We should note that we have been willing to lock in yields on Treasury securities with yields in excess of 4.5% when market conditions have allowed. That has come to be a significant part of the fixed income component of portfolios for many of you. A 4.6% one year note only gives you 1.15% on a quarterly basis but the principal is guaranteed. After last year, having some of the return “locked in” just seems to make sense.
Outlook
The market expects three things – a mild recession, for the Fed to “pivot” from raising rates to cutting them, and for “growth” stocks to outperform. The Fed insists it has no plans to cut rates. Growth stocks have surged anyway whenever conditions have changed in such a way as to make a Fed pivot seem more likely – weaker retail sales or industrial production or home sales perhaps, or in mid-March it was the Silicon Valley Bank debacle. Eventually, some economic report, such as the employment, inflation, and housing prices, comes out stronger than expected which throws cold water on the pivot argument. As a result, the Fed hikes rates again. Growth stocks then sell off in disappointment. This is a “chase your tail” game and we’re going to be patient and not get caught up in it.
Corporate earnings declined in the 4th quarter of 2022 and they are expected to decline this quarter and next quarter as well. Simple math says that as long as earnings are declining, stock prices are getting more expensive, and time is not on your side. Over the long term, I am very confident that earnings as a whole will rise. They always have in the past, and the system is not broken. It is just a question as to whether investors can continue to see past the near term weakness.
If you have the fortitude to stay the course as annualized S&P 500 earnings fall from $228 to $217 to $208 to $199 (for example) before bottoming out and recovering to perhaps $220, $243, and then $265 by the end of 2024, then it makes obvious sense to hold on here – maybe even add if stock prices dip too far. My experience, however, is that investors tend to lose their nerve at some point as conditions continue to deteriorate. I just don’t think the next big bull market will begin from S&P 4100 (where we are today); I believe it will require a better value proposition (cheaper prices) or a drastically altered economic landscape in which earnings growth takes off like a rocket. The latter seems highly unlikely given the Fed tightening cycle and the recent bank failures. We can, however, continue to avoid any meaningful sell-off as long as investors remain relatively confident. The linchpin of that confidence is a near-term Fed pivot – investors won’t sell if they believe the catalyst to higher prices is close at hand. This is what we have to keep our eyes on.
Commentary – In a Trading Range You Do Things Differently
“Bull” markets behave in a classic way – a stock will go from $60 to $80 and then to $100 and above. The key for an investor during periods like this is to determine which parts of the investment universe are making that journey the fastest and look for a factor that is driving them that you can exploit. Maybe it’s that a particular market segment in the right industry, maybe that segment is boosting dividends or announcing share buybacks. An investor just needs to identify the catalyst fueling higher prices, and then believe that force is continue. Again, during typical bull markets corporate profits, and profit margins, are growing such that the “runway” for favorable conditions tends to be long. Occasionally there will be hiccups and adjustments will be necessary, but in general the trend is your friend and the best way to goof up and hurt your performance is to overthink it.
At the end of the economic cycle, however, the economy gets tired. Too much credit has been extended to non-worthy borrowers and interest rates have to be raised in order to purge the system of excesses so that a new expansionary phase can begin. During these periods the runway is short; stocks do not make new high after new high as they do during bull markets. They correct investors’ overenthusiasm by selling off, then they gradually work back toward their old highs only to fail to make new highs and sell off again. This is what is known as a trading range. Buying momentum in a trading range environment will not work; it will only lead to disappointment.
As noted above, corporate profits are falling today as the Federal Reserve’s tightening efforts are beginning to bite. Recessions typically begin about a year after the last Federal Reserve interest rate hike, and new bull markets tend to begin before the recession technically ends. It should be noted that the Fed hasn’t stopped hiking yet, so the bull market watch clock hasn’t even started ticking.
We’ve had economic environments somewhat similar to this one before. The ones I’m thinking of are the late 1980s and 2001 pre-9/11. In 1986 plunging oil prices created a speculative fever that led to a 35% spike and crash in 1987. Markets traded “choppily” in 1988 and 1989 as speculative excesses were wrung out. Similarly, we had a tremendous dot.com boom in 1999 partially fueled by the Federal Reserve dumping reserves in the system in case there was a system shutdown tied to Y2K. The rapid withdrawal of those reserves in early 2000 led to the dot.com crash that year and then choppy sideways trading in 2001. This go-round, the government and the Fed threw money at the economy to avert a broad economic collapse and market crash in 2020 tied to Covid-19 and largely kept the spigots open through 2021. 2022 was our “crash”, but I expect it to take at least another year of back and forth for the current excesses to be wrung out.
Sector performance courtesy of S&P per Morningstar
Bond returns from Bloomberg via Morningstar. Commodities and Gold returns from Dow Jones via Morningstar.
Growth stocks tend to perform better when interest rates fall (to the extent that interest rates reflect inflation expectations) because the lower inflation is, the less a dollar earned in the future needs to be discounted from $1.00 to reflect purchasing power loss. Growth stocks derive more of their value from expected future earnings than value stocks (which are mostly valued on net present value).
DISCLOSURE
Past performance is no assurance of future results. Trademark Financial Management, LLC (“Trademark”) is a registered investment adviser with its principal place of business in the State of Minnesota. Trademark and its representatives are in compliance with registration requirements imposed upon investment advisers by those states in which Trademark operates. Trademark may only transact business in those states in which it is registered or qualifies for an exemption or exclusion from registration. This newsletter is limited to the dissemination of general information pertaining to its investment advisory/management services. Any subsequent, direct communication by Trademark with a prospective client shall be conducted by a representative that is either registered or qualifies for an exemption or exclusion from registration in the state where the prospective client resides. A complete list of all recommendations will be provided if requested for the preceding period of not less than one year. It should not be assumed that recommendations made in the future will be profitable or will equal the performance of the securities in this list. Opinions expressed are those of Trademark Financial Management and are subject to change, not guaranteed and should not be considered recommendations to buy or sell any security. For information pertaining to the registration status of Trademark please contact Trademark at (952) 358-3395 or refer to the Investment Adviser Public Disclosure web site (www.adviserinfo.sec.gov). For additional information about Trademark, including fees and services, send for our disclosure statement as set forth on Form ADV from us using the contact information herein or by calling 952-358-3395. Please read the disclosure statement carefully before you invest or send money. Any reference to a chart, graph, formula, or software as a source of analysis used by Trademark Financial Management staff is one of many factors used to make investment decisions for your portfolio. No one graph, chart, formula, or software can in and of itself be used to determine which securities to buy or sell, when to buy or sell them, or assist any person in making decisions as to which securities to buy or sell or when to buy or sell them. Any chart, graph, formula, or software used is limited by the data entered and the created parameters. The data was obtained from third parties deemed by the adviser to be reliable. Nonetheless, the adviser has not verified the results and cannot be assured of their accuracy.
Summary
First of all, we are happy to report that the fourth quarter of 2022 was a positive one for both stocks and bonds. This allowed the year to finish well above the September lows. The S&P 500 closed with a 7.56% quarterly gain, reducing its full year loss to -18.11%. Value industries such as energy and materials gained 22.86% and 15.05% respectively, while growth industries like technology rose just 5.14% and consumer discretionary lost -9.09%.
Maybe the biggest surprise last quarter was the strength in foreign stock markets. Left for dead due to the Ukraine conflict, fears about energy prices in the coming winter in Europe, Covid lockdowns in China, and other concerns, international stocks blasted upward by 17.34%. There is a lesson here in terms of how profitable it can be to invest in an area when one’s fellow investors have all but written it off. Europe has had a very mild winter so far, such that its aggregate energy usage is much less than forecast, enough so that analysts are moving away from their earlier forecasts of a deep recession. China has recently lifted all Covid-related mobility restrictions, which has produced a bit of a boom in consumer- and raw material-related stocks.
Bonds also gained during the quarter. True, their gain of 1.87% made just a minor dent in the -15% plus losses sustained in the bear market from November 30, 2021 to October 24, 2022, but it looks increasingly like a major bottom was made on that day. After a decade of receiving yields so tiny that they didn’t nearly compensate for taxes and inflation (low as it was at that time), bond investors can now obtain yields of over four percent on government bonds and six percent or more on many high quality corporates. The dollar’s decline during the quarter finally revived international bonds, which had struggled mightily over the past three years. They rose 2.58%, according to Morningstar, after falling more than 14% over the previous three quarters.
Alternative assets had a mixed quarter. Gold rose 9.45% on investors’ belief that central banks would have to ease up on interest rate hikes as inflation itself was peaking. On the other hand, energy prices turned lower which in turn dragged down the returns of managed futures funds by an average of 3.43%. Real estate-related interval funds, which had completely sidestepped the nearly 30% correction in publicly-traded real estate companies in the first nine months of the year, belatedly began to reflect negative effects of rising rates.
Activity
After bottoming out in terms of international exposure in the third quarter of 2022, we began to add back to it last quarter as the U.S. dollar made a significant top in October. The dollar is the key to the performance of “risk assets” outside of the United States – as cheap as foreign assets had become, the dollar needed to stop rising in order for those assets to move up. Like a beach ball held underwater, once the dollar trend finally turned lower, foreign asset prices shot upward. Outside of tax-related balancing of gains and losses, most of the changes made during the quarter were either driven by the reversal in the dollar or the desire to by less “tech-heavy” in our growth funds..
By October, bond yields had risen to levels that we had not seen in years, so we also did some “bottom-fishing” in the long-term end of the bond market. As inflation slows, yields come down and allow longer term bonds to make a nice profit. It is always hard to buy securities when they are down 25%-30% year-to-date (as they were back then), but I’m already wishing I had purchased larger positions.
Outlook
As this is being written, the primary driver in the markets is the deceleration in inflation. This has led to speculation about when the Federal Reserve will stop raising rates (and in fact when they might pivot to cutting them again). This is inherently a bullish conversation, standing in direct opposition to the one we were having a few months ago which was essentially “how high does the Federal Reserve need to get interest rates in order to break the upward trend in inflation”? The falling inflation narrative will be constructive to stock and bond prices as long as it lasts. That said, we are heading into corporate earnings reporting season in a couple of days. This is not likely to change the positive short-term dynamics in the bond market, but it certainly could for stocks if companies start warning about lower sales and higher costs. Let’s hope that doesn’t happen.
Commentary – “Di-Worse-ification”
The second half of the 20th century was the heyday of investment theory. Before this time investors tended to be either speculators or income collectors. They did not look at their holdings as a “portfolio”, so they did not think about how much or how little each security correlated to the others. As a result, the values tended to rise and fall in tandem (at different rates, of course). The thought that one might achieve better results by combining securities with different attributes such that they did not all rise or fall at the same time just did not occur to most investors. Then William Sharpe, Jack Treynor, Harry Markowitz, Robert Merton, Fischer Black, and others came along and turned portfolio management into a science. No longer would portfolio managers get away with buying a few promising stocks and/or bonds and hoping for the best; now there were multiple tools to assess risk-adjusted return (and advanced knowledge of mathematics would be required). These Nobel laureates taught us that markets were more or less efficient, and for a little while it actually seemed like they were.
The “Dot.com Crash” in 2000 was the first in several blows the brave new world of investment theory has suffered this century. Clearly markets couldn’t be efficient if Cisco Systems could trade above $150 in March 2000 and under $40 less than eighteen months later. Diversification, the idea that risk-adjusted returns could be improved by putting a lot of different “eggs” into one’s investment “basket” (versus loading up on the type of egg judged to be the best), similarly looked to have been disproved lately as U.S. stocks outperformed during both good and bad times over the past decade. Noting this, a clever pundit coined the term “De-worse-ification”.
A review of asset class performance over the past twenty-five years, however, shows that performance for any particular asset tends to go through multi-year periods of better and worse returns. During that period large company U.S. stock performance were first or second of the ten major asset categories every year from 1995 through 1998, then they didn’t crack the top five of ten in ANY of the next twelve years. Large U.S. stocks jump back into the top five (second) in 2013 and remain in the top five every single one of the next nine years (2013-21) before breaking the streak last year. Similarly, foreign developed and emerging markets each land in the top four every year between 2003 and 2007, but thereafter are only found in the top four together once (2017).
The lesson here is to think about diversification not as something that adds value during a particular market decline but over one’s investment lifetime. An asset class can be out of favor and underperform for the better part of a decade. In fact, some diversification models include gold and oil as additional asset classes to those referenced above. Gold and oil can and have remained out of favor for very long periods of time (close to twenty years), but when they “pop”, they can provide very exciting returns – as oil did last year.
What diversification does do, reliably, is compress the range of potential returns. It takes the highest possible return (100% of one’s in the best asset) out of the equation, but it also removes the worst. Mathematically, it averages out better than the midpoint between the best and worst asset classes, so it is what we call “risk-efficient”. That is why despite it not working well from time to time, diversification remains a foundational principal of investment management.
A little more background might be helpful. The period from 2017 though 2021 was exceptionally frustrating as an investment manager. Large cap U.S. stock had fallen out of favor in the decade of the “oughts”. By 2012, they were priced very reasonably provided the economy did not lapse back into recession. It didn’t, and 2013 through 2016 provided very nice returns for investors (especially in technology). By 2017, U.S. stocks were no longer cheap, and yet they added another 22% that year. In 2018 interest rates began to rise as they typically do late in an economic expansion. Every single asset class suffered in 2018 relative to 2017. That said, large cap U.S. stocks remained a top asset class even with a slight loss; all other equity classes posted double-digit losses. Then they rose another 31% in 2019.
When Covid hit in early 2020 and markets sold off worldwide, it looked like we were finally going to see the kind of correction that would bring large company stock returns back into line with other asset classes, allowing investment returns to be more evenly distributed. In fact, just the opposite happened. Technology’s leadership over the rest of the market only intensified post-Covid, and the performance advantage of U.S. stocks over their foreign counterparts went from large to unprecedented. The extreme out-performance of a handful of American technology companies distorted everything. Any investment professional with a cursory knowledge of history and mathematics knew this couldn’t last, but when and how would it stop?
Finally, last year, the “tech fever” fully broke. The end was foreshadowed in 2021 when the most speculative, loss-making companies began declining in earnest, but it took an inflation spike, a regional war, an oil spike, and 400 basis points of Federal Reserve tightening to finally burst the bubble. Every one of those high-flyers is now more than 25% off its all-time high while energy, consumer staples, and industrial stocks tend to be less than 5% from their highs. Even international stocks are only 15-20% off their all-time highs. Diversification seems to be working once again. Investment theory, as taught by the CFA Institute and the College of Financial Planning, is actually describing the real world again.
I am very excited about the opportunities I have as an investment manager today because all asset prices are much more reasonable. Unlike the entire decade of the 2010s I can get fair compensation relative to inflation for holding a bond. With tech fever having ended, I am not being pushed to over-weight portfolios to an industry sector that I know cannot fulfill the unrealistic growth and profit expectations the market has attached to it. There are many attractively priced stocks outside the United States that are finally starting to attract interest.
At Trademark Financial Management we run diversified portfolios. Not because they are guaranteed to produce better returns (they aren’t) but because diversification provides better risk-adjusted returns in an environment where one does not know what the future will bring in terms of asset class performance. We look for trends, and we monitor changes in the narratives that drive stocks and bond prices at any given time. We will overweight, modestly, those parts of the market that have relative strength compared to other areas, those parts of the market that are more reasonably priced than other areas, and those that fit the narrative currently driving market movements. On the other hand, we will underweight (again modestly) those areas that are either expensive or being de-emphasized by the current narrative. Over the long term, that should lead to above average performance.
Standard and Poors 500 Index, per Morningstar Workstation
S&P Dow Jones Indices, per S&P Global, December 30, 2022.
MSCI EAFE, per Morningstar Workstation
Because you are essentially asking, “Are stock prices going to go up sooner or later”? The previous question was essentially, ”For how long does the stock market need to decline”?
DISCLOSURE
Past performance is no assurance of future results. Trademark Financial Management, LLC (“Trademark”) is a registered investment adviser with its principal place of business in the State of Minnesota. Trademark and its representatives are in compliance with registration requirements imposed upon investment advisers by those states in which Trademark operates. Trademark may only transact business in those states in which it is registered or qualifies for an exemption or exclusion from registration. This newsletter is limited to the dissemination of general information pertaining to its investment advisory/management services. Any subsequent, direct communication by Trademark with a prospective client shall be conducted by a representative that is either registered or qualifies for an exemption or exclusion from registration in the state where the prospective client resides. A complete list of all recommendations will be provided if requested for the preceding period of not less than one year. It should not be assumed that recommendations made in the future will be profitable or will equal the performance of the securities in this list. Opinions expressed are those of Trademark Financial Management and are subject to change, not guaranteed and should not be considered recommendations to buy or sell any security. For information pertaining to the registration status of Trademark please contact Trademark at (952) 358-3395 or refer to the Investment Adviser Public Disclosure web site (www.adviserinfo.sec.gov). For additional information about Trademark, including fees and services, send for our disclosure statement as set forth on Form ADV from us using the contact information herein or by calling 952-358-3395. Please read the disclosure statement carefully before you invest or send money. Any reference to a chart, graph, formula, or software as a source of analysis used by Trademark Financial Management staff is one of many factors used to make investment decisions for your portfolio. No one graph, chart, formula, or software can in and of itself be used to determine which securities to buy or sell, when to buy or sell them, or assist any person in making decisions as to which securities to buy or sell or when to buy or sell them. Any chart, graph, formula, or software used is limited by the data entered and the created parameters. The data was obtained from third parties deemed by the adviser to be reliable. Nonetheless, the adviser has not verified the results and cannot be assured of their accuracy.
Summary
As hard as it would have been to believe, three months ago, that the stock and bond market could both continue to decline, they both did. U.S. stocks gave up an additional -4.88% while bonds moved -4.75% lower. Through the first three quarters of 2022, stocks are off -23.87% and bonds stand at -14.61%. A 60/40 mix of stocks and bonds, long considered the benchmark for diversified portfolios, would have lost -20.17%. There are only two years, since records have been kept, that a blended stock and bond portfolio has lost -20% or more; 1931 (the heart of the Great Depression) and 1974 (Arab oil embargo). This kind of year only comes around every 40-45 years or so. If it is any consolation, both 1931 and 1974 were followed by two consecutive years of 15%+ returns.
Figure 1: 60/40 Portfolio Returns 1926-2022
Small cap stocks peaked on November 8, 2021 and through September 30th, 2022 had declined a little over -32%. Compare this to the S&P 500, which didn’t peak until this past January 4th and is only down -25.23%. Small caps only shed -2.19% last quarter, so it’s possible that they are bottoming earlier and will lead the next bull market; they certainly lagged during the last one (especially after September 2018). Energy has been the only stock sector of refuge this year, gaining over 40% and even that sector suffered a -24.5% plunge between June 8th and September 26th. 2022 has seen nice but short rallies followed by relentless grinding declines to lower lows in almost every sector, including those that traditionally hold up during periods of stock market weakness (utilities and real estate) or inflation (gold/precious metals).
International stocks lost another -9.36% last quarter, leaving them off -27.09% year-to-date. Latin America, which is heavy in natural resources-related companies, rose last quarter and is modestly ahead over the first nine months of the year. Japan is down close to -27% this year but that is mostly due to a plunge in the yen versus the dollar; in yen terms the Nikkei is close to flat on the year. Elsewhere, however, things are just not good. Asia (aside from Japan and India) is suffering from the continued contraction of the Chinese economy and Europe is being clobbered by Russia’s Ukraine war and its own mismanagement (looking at you, England).
Rising bonds yields have served as the main catalyst for this year’s poor market performance. Bonds continue to suffer from several headwinds:
1. Inflation continues to surprise on the upside. Goods prices are moderating, but wages and housing costs are still rising greater than 5%.
2. World central banks are selling dollar-based securities (bonds) to limit the rise in the dollar against their currency. Remember, the price of a bond moves inversely to the yield on that bond.
3. The U.S. Federal Reserve is selling bonds to banks to take money out of circulation, thereby cooling economic activity (and hopefully inflation as well). On the plus side, yields on the benchmark 10-year Treasury Bond are now over 4%, so savers are finally beginning to get rewarded. The fact that bonds now yield more than twice as much as stocks provides a good rationale for believing that bonds will be attractive once the Fed stops raising rates. We are already seeing institutions selling stocks to buy bonds because they can lock in actuarily acceptable returns. While 2022 has seen the worst high quality bond sell-off in over forty years, it seems very likely that the worst is now over.
ActivityWe have been very active this year because markets have been very difficult. In many model portfolios, we have hedged the dollar exposure in international bonds and in part of our international stock portfolios. We also have added commodity exposure, bond alternatives and interval funds in some portfolios. We now have very little exposure to the most volatile area of the stock market, small cap growth funds. The goal has been to get defensive, but not so defensive we wouldn’t participate if there was a meaningful rally in risk assets.
Figure 2: Stock and Bond Returns. Very rare to see both stocks AND bonds doing so badly at the same time. In down years, bonds almost always act as “ballast” to cushion the blow from falling stock prices.
OutlookAt this point, it seems fairly certain that 2022 is going to be a “red marble” year. The hope around mid-year was that inflation would show signs of moderating in the third quarter of 2022 such that the Federal Reserve could be done tightening by year-end. Anticipating this, investors would begin to buy stocks. In fact, this did happen between late June and mid-August. Unfortunately, the July Consumer Price Index report, released in mid-August, was just too strong. It forced Fed Chairman Powell to make a very hawkish speech the next week at the annual Fed conference in Jackson Hole, Wyoming, which crushed the 2022 hopes of both bond and stock investors. He said the Fed is not going to stop raising interest rates in 2022, and furthermore they do not expect to begin to lower them any time in 2023. This was not what investors wanted to hear.
This creates a dilemma. U.S. stocks are not expensive now if one believes that the economic downturn the Fed is engineering in order to bring down inflation is not going to be either deep or long-lasting. In fact, if corporate earnings decline modestly into 2023 as margins contract but begin to rebound in the second half of next year, the market may rally. It should be noted that there are two key “ifs” in the last two sentences, and we aren’t even considering Russia, China, and potential inclement weather affecting consumption, so there are no guarantees. That said, we finally have hit price levels on many companies for which a patient investor today is likely to make a nice return by 2025 or 2026. Investors just have to have the fortitude to hold on, because the next few months are likely to contain more negative surprises than positive ones.
The good news is that big declines are often followed by big gains (though this should not be taken as a guarantee):
Commentary – Beware the V
We receive a tremendous amount of research every day concerning the economy, the stock and bond markets, interest rates, real estate, global geopolitical developments, trading strategies, and more. Sometimes I receive something so useful I immediately think, “that’s going in the Commentary”. Such was the case with this chart I was recently sent by Goldman Sachs. It shows the average performance of the S&P 500 stock index during a bear market. As you can see, the decline begins with a long meander, such that one doesn’t even think about it as a bear market. Some market sectors are performing well, while others have rolled over.
Almost every market pundit refers to this first -5% down move as being a “correction”, the implication of which is that it’s nothing more than a chance for over-exuberant areas of the market to cool down a bit before the next upward phase. This represents about 75% of the downturn time-wise. The final -25% is the breakdown and then the capitulation. The breakdown sees accelerated losses compared to the previous phase. The capitulation, where the losses seem relentless and every day investors berate themselves for not selling yesterday or better yet last week, usually doesn’t last very long – it just feels that way.
These declines typically end in what we professionals call a “V-bottom”. When selling goes on for several days in a row and has changed from rational and orderly to panicky and indiscriminate, stocks with strong outlooks are sold alongside those with poor prospects. Sophisticated investors wait for just such an opportunity and when it comes they buy in loudly, hoping others will follow behind them. Warren Buffett of Berkshire Hathaway and Jamie Dimon of JPMorgan are known for having gone on CNBC at the height of especially difficult periods and announced they were buying, leading to sharp reversals. As the chart shows, the opportunity to buy right at the lows is all but impossible. Once investors realize that the “cavalry” has arrived, the stock market can be 10-15% off its lows in a very short time. V-bottoms occurred on February 11, 2016, February 8, 2018, December 26, 2018, and March 24, 2020. If you sold at or near the height of the panic, you could not recover – there was no opportunity in subsequent days, weeks, or months to buy back in anywhere near the lows. In the world of professional money managers, doing so is referred to as “permanently impairing capital” because the sale, and lack of market recovery participation, locks in the loss for all future time periods.
These V-bottoms are the bane of professional money managers. We don’t want to participate in the highly volatile late stage of a market breakdown, but we know that time is on our side – markets tend to rise over time because corporate profits in the aggregate tend to rise over time. For example, in the year ending December 31, 1971 S&P 500 earnings were $41.16 per share; fifty years later they were $210.65 – more than 5 times higher. Selling always carries some risk because it involves fighting against the current of rising earnings. Thus, the worst case scenario is to sell at the nadir of a V-bottom. There are two strategies to avoid making this catastrophic mistake. One is to never sell. You just ride out the difficult market periods with the knowledge that capitalism tends to funnel assets ultimately towards productive capacity and there is no reason to expect it won’t this time either. The other is to reduce positions gradually. The logic is that if portfolios are made less risky in increments, some of the sales will have taken place well before the ultimate bottom, such that one can buy back in before stock prices return to the level at which those sales were made. The strategy has the advantage of losing less into the worst part of downturn, but it also carries the risk that by the time one realizes that the market has truly bottomed, re-purchases will occur at higher levels.
Statistically, one should expect short term downturns not to turn into major bear markets, because they usually don’t. Therefore, also statistically, one should not be a net seller when stocks go down. Yet there are exceptions to the rule. In NBA basketball, statistically, one should only shoot 3-point shots because the expected value of a three-point shot (3 points times 37% likelihood of success equals 1.11 points per possession) exceeds that of a two-point shot (2 points times 45% likelihood of success equals 0.90 points per possession). The exception is the lay-up, of course. Lay-ups are made 58% of the time, so the expected points per possession is 1.16 – better than that of a 3-point shot . Markets are of course difficult to predict. The odds of stocks rising on a given day is 54% – only slightly better than a coin flip. Yet every so often prices get so out-of-whack with fundamentals that at least some type of decline seems like a lay-up.
The trick, as always, is to know when you are in one of these periods. Last year I believed that stocks and bonds had become considerably overvalued, so I started shifting some of our models into investment we believed would be more stable in a downturn. While the most egregiously overpriced consumer technology start-ups (Zoom, Peloton, Draftkings) did in fact decline -40% or more in 2021, the biggest blue chips like Apple, Microsoft, and Tesla still soared over 30% each. Lay-up missed. This year we are benefitting from alternative funds and from the underweight to big growth stocks, so in a sense we are one for two. If stocks continue to struggle for a while, our strategy may prove to be helpful (as it will have both reduced volatility and generated higher returns). If the market makes a sharp V-Bottom leading to a lasting recovery, then our action will probably not have been accretive to value.
Hopefully this commentary has demonstrated the difficulty of navigating market declines. It is easy to say that one saw a decline coming but much harder to time when to get in and when to get out. Because of this, we have adopted a gradualist strategy of frequent minor adjustments to risk level as opposed to an “in-or-out” kind of strategy. We know that we will be wrong from time-to-time, but we try to keep the consequences of this small. On the other hand, poorly timing an “all-or-nothing” strategy would be a disaster if the market traces out a V-bottom pattern (as it tends to do if the Federal Reserve makes a strong pivot).
One should not be a stock investor if one does not understand that the markets will give even diversified investors a -20% loss from time to time (especially in those rare situations where bonds do not mitigate volatility but in fact make them worse). On the other hand, bear markets losses of 40% or more have historically been avoidable by shifting a portion of the portfolio into cash, cash equivalents, or other non-correlated assets. The less a portfolio declines, the quicker it can recover in the next bull market.
We are doing our best to navigate this environment. We welcome any questions or comments you might have about your portfolio.
Per Morningstar Workstation
Point-to-point performance information here and elsewhere from Y Charts. Russell 2000 Index used as the proxy for small cap stocks.
Per Morningstar Workstation
The marble concept was introduced in our 2nd Quarter 2022 Commentary to note a year of significant stock losses. This differentiates it from a pink marble (minor loss), grey marble (minor gain) or black marble (major gain) year.
Multpl.com
Dispatch.com
DISCLOSURE
Past performance is no assurance of future results. Trademark Financial Management, LLC (“Trademark”) is a registered investment adviser with its principal place of business in the State of Minnesota. Trademark and its representatives are in compliance with registration requirements imposed upon investment advisers by those states in which Trademark operates. Trademark may only transact business in those states in which it is registered or qualifies for an exemption or exclusion from registration. This newsletter is limited to the dissemination of general information pertaining to its investment advisory/management services. Any subsequent, direct communication by Trademark with a prospective client shall be conducted by a representative that is either registered or qualifies for an exemption or exclusion from registration in the state where the prospective client resides. A complete list of all recommendations will be provided if requested for the preceding period of not less than one year. It should not be assumed that recommendations made in the future will be profitable or will equal the performance of the securities in this list. Opinions expressed are those of Trademark Financial Management and are subject to change, not guaranteed and should not be considered recommendations to buy or sell any security. For information pertaining to the registration status of Trademark please contact Trademark at (952) 358-3395 or refer to the Investment Adviser Public Disclosure web site (www.adviserinfo.sec.gov). For additional information about Trademark, including fees and services, send for our disclosure statement as set forth on Form ADV from us using the contact information herein or by calling 952-358-3395. Please read the disclosure statement carefully before you invest or send money. Any reference to a chart, graph, formula, or software as a source of analysis used by Trademark Financial Management staff is one of many factors used to make investment decisions for your portfolio. No one graph, chart, formula, or software can in and of itself be used to determine which securities to buy or sell, when to buy or sell them, or assist any person in making decisions as to which securities to buy or sell or when to buy or sell them. Any chart, graph, formula, or software used is limited by the data entered and the created parameters. The data was obtained from third parties deemed by the adviser to be reliable. Nonetheless, the adviser has not verified the results and cannot be assured of their accuracy.
Summary
Sometimes a quarter passes and nothing much happens. Other times, so much happens in a quarter that it seems like a full year. The first quarter of 2022 falls into the latter category. Supply bottlenecks and then, of course, the inflationary implications of the war in Ukraine brought large price changes to bonds (negative) and commodities (positive). Energy and resource-related stocks were the biggest beneficiaries because supply disruption translates to higher selling prices. Other sectors could not as easily pass on their higher costs. Technology and consumer discretionary stocks were the biggest losers in the latter category, dropping around nine percent.
The S&P 500 large company stock index, down more than -10% on March 14th, managed to recover over half of that by quarter end to finish off -4.6%. The late quarter bounce was driven by the desire for safer, larger, dividend paying stocks, thus small caps had a much smaller bounce and finished -7.5%. The technology-driven NASDAQ Composite Index was off -8.9%. As we shall see below, there was no help from foreign stocks or bonds last quarter; only utilities and commodity-oriented funds managed to post a gain. Energy was far and away the best sector last quarter, but as it represented less than 4% of the S&P 500 at the start of the quarter, it could hardly offset the negative impact of technology (almost 25% of that index).
As a whole, international stocks were down -5.9% last quarter. Again, there were bright spots. Latin America, on the strength of soaring demand for Brazilian oil, Argentinian agricultural products and Chilean copper (among other things) roared ahead 27.3% last quarter. That said, Latin America accounts for less than 2.5% of the total international index, so the drag from Europe (-9.6%), China (-14.5%) and Japan (-6.6%) was just too strong. Most international markets were not helped by ongoing strength in the U.S. dollar.
The current drawdown, which began in late 2020, is the worst drawdown for bonds in over 30 years. This chart was first published by Lyn Alden Research, a great source of market information.
Bond investors experienced their worst quarter in more than 40 years. The benchmark Bloomberg Aggregate Bond Index fell a staggering 5.9%. Considering that the index yields around 2%, roughly three years’ worth of coupon payments were lost last quarter. The bond market had been telegraphing weakness for quite some time, so we were able to substantially reduce interest rate sensitivity before bond yields had their big post-invasion spike. Other than short term floating rate treasuries (+0.2%), one could not have made money in bonds this past quarter. Municipal bonds performed especially poorly (-6.2%) as very low yields and overbuying in 2021 made them particularly vulnerable to rising interest rates and investor flight. High yield corporate bonds lost -4.8%.
Activity
Since this was a very eventful quarter, there was much more activity than usual. As interest rates rise, future earnings become less and less valuable relative to current earnings. If the rise in interest rates is gradual, the stock market tends to take it in stride. If rates rise sharply, as they did this past quarter, the stock market gets alarmed. In fact, the whole valuation paradigm of the market can be thrown into question. Specifically, if the prevailing environment is low and generally declining interest rates, as it had been the great majority of the time between 2009 and 2021, it makes sense to pay up for rapidly growing companies even if that rapid growth is still in the revenue stage and had not progressed to actual net profits. If, however, interest rates begin to soar and funding costs climb, investors quickly tire of rapidly growing, unprofitable, companies that need to spend every dollar of revenue to fund growth. Not when they can buy a company that is already profitable and seeing demand for its products grow such that it is able to raise prices faster than its input and labors costs are rising. This is how natural gas and coal investors make 35% in a quarter while biotechnology and software-as-a-service investors lose 35%. Growth is out, value is in. Small caps, especially if they are growth-oriented and outside the U.S., are especially vulnerable when the paradigm changes back to “bird-in-the-hand” companies and away from “two-in-the-bush”.
Growth makes a big run about once in a generation, but the outperformance doesn’t last. It’s previous run (1968-72) was erased by the end of 1974.
The number of changes necessary for most portfolios required a complete re-balance. Because we had already reduced the duration (interest rate sensitivity) of the bond portion of portfolios in 2021, the biggest change on the bond side last quarter was the outright substitution of alternatives like commodities, real estate, or merger arbitrage for coupon paying bond funds.
Outlook
In my investing career I have never seen a wider range of possible market and economic outcomes than exist today – Doug Kass, President, Seabreeze Partners
First of all, bond yields have moved up a considerable amount in a very short period of time, so I expect yields to stabilize in the short run. That should be a positive. I am concerned that the Federal Reserve has, because it was overly accommodative in 2019 and again in 2021, put itself in a position where it probably needs to err in the other direction over the next few months. The resulting contraction in liquidity is probably not going to do markets much good. With an ongoing crisis in Ukraine and the midterm election coming up, it just feels like the headwinds exceed the tailwinds this year. Allocating a higher percentage to hard assets like industrial and agricultural commodities, precious metals, and energy seems like a prudent way to get through what promises to be a prolonged period of above average inflation.
Looking farther out, the recent correction in growth stock prices has made this sector of the market much cheaper. Strong companiesthat sported eye-watering P/E multiples last year such as Adobe, Chipotle, Nvidia, and Intuitive Surgical are down 20%-40%, so while not cheap per se, they are at least much more reasonable. They have a good chance of rallying once investors believe that the end of the Federal Reserve rate hiking cycle is in sight.
Commentary– of Trends, Wolves, Torches and Lebron James
It’s a tough quarter when somewhere around 96% of one’s investable universe declines in price, but that happens sometimes. I’ve certainly gone through many quarters when 96% or more of everything we track went up in price. When the interest rate and liquidity trends are at your back, investing is fairly easy. On the other hand, if those trends are working against you, investing is much harder – with the only reward sometimes being that one loses less. That doesn’t have to be a bad thing. Investing is cyclical. Bad periods set up good periods, and vice versa. You cannot survive as a money manager projecting current trends into infinity.
I remember when the yield on the 10-year bond fell to less than 0.6% back in August 2020. That was great if one had been a bond buyer in any of the previous 40 years, but where do you go from there? Inflation was running at about 2%, so buyers at 0.6% were getting no inflation protection. The only chance of a positive real return was that interest rates went even lower. You didn’t need to know that interest rates were going to soar in the first quarter of 2022 to know that buying the 10-year at that point was a terrible bet. It was like watching Lebron James score 55 points in a basketball game and betting that he will score 60 points in the next game. It’s not impossible, but the odds are not in your favor. The odds were also not in your favor if you paid $500 per share for Zoom Video in October 2020 or $160 for Zillow in February 2021. You were betting that an explosive trend (in this case, shop from home) would continue to grow at exponential rates.
The nature of trends is that the longer they last the more powerful they tend to be, but that all trends eventually end. Stocks with a high and consistent rate of annual earnings growth (growth stocks in the parlance) performed extremely well in the low interest rate environment of the past decade. On one hand it was a mistake to assume their outperformance would end simply because they had become expensive (in some cases very expensive), because bull markets are generally not killed off by valuation. On the other hand, it was a mistake to assume the growth stock run would never end. Rising rates and tight credit are like kryptonite for growth stocks. There were two periods – late 2015 into 2016 and late 2018 – where worsening credit conditions led to 15-20% drops in growth stock prices. In each case, the economy slowed, the Fed reversed itself, and these stocks were off to the races again. Therefore, an experienced manager doesn’t panic when growth stocks hit an 8-10% skid as they did in February and again in October of 2021.
The decline that began on December 28th of last year was not a concern until the rally attempt at the end of January quickly failed and lower lows were made – even before the Russian invasion of Ukraine. This was new. As the market began to digest the impact of wage inflation driven by the difficulty finding qualified available workers and of goods inflation driven by raw materials shortages and shipping bottlenecks, it was suddenly confronted with a regional war. A significant amount of energy and agricultural commodities were effectively taken “off-line” through a lack of available workers (Ukraine) or embargo (Russia) – which only makes the goods inflation situation worse. At this point we had not just a sell-off but a change in the narrative driving the market – that rising inflation wasn’t a transitory event but in fact a structural change that would usher a new group of companies into market leadership.
The point here is that the first perhaps 5-8% stock market decline is noise. Markets fluctuate. If you aren’t conformable with that, you should probably buy a CD or a fixed annuity instead. Most declines of this magnitude don’t last very long. The proper course of action in most cases is to do very little. Every so often, however, the market will cry wolf and there will actually be a wolf. Those are the times where you have to be prepared to act. As a manager, I really don’t expect to add value in a 5% decline. I’m not going to radically change a portfolio for a decline that small or else I’d constantly be buying and selling. I also know that it is hard to add value in a crisis decline like March 2020 because that situation was completely emotional and nearly impossible to model. Where managers can add the most value is in a prolonged decline. The more the market loses, the less I expect to participate in that decline because I can discern what the new narrative is and I can re-position portfolios away from the most vulnerable areas. The bear market that ran from March of 2000 through October 2002 was much easier to outperform after the Autumn of 2000 because it had become clear that the growth narrative had been broken and the technology sector no longer carried the torch of market leadership.
Periods of strong performance almost always lead to periods of low performance, because as asset prices rise in excess of the increases in their intrinsic value, valuation deteriorates. Happily, that process also works in reverse. If we have to endure a multi-year period of poor bond returns while bond yields rise to a level that better compensates us for taking inflation risk, that’s fine. We’ll get through it by underweighting bonds and overweighting hard asset alternatives. After a decade of fairly poor-to-terrible returns, most commodity producers are undervalued despite having done very well this year. The conditions they required in order to thrive have finally come to pass. Energy stocks are about 4% of the S&P 500 and Basic Materials stocks are less than 2.5% today – less than half of where they were at their peaks in 1980. That’s kind of like betting on Lebron the game after he’s just had a 15 point game; not a guarantee but attractive from a probability standpoint. At the end of the day, as investment managers, that (putting the odds in your favor and watching carefully to see that they remain there) is one of the most impactful things we can do.
Updated Statement Benchmarks
Please note that we updated the benchmarks on our quarterly statement to be in greater alignment with industry standards. We believe the updated benchmarks better highlight the broad array of investment possibilities as they more clearly delineate the asset classes in which we invest. A brief explanation of our new benchmarks is below. Please don’t hesitate to reach out with questions.
S&P 500
The S&P 500 is used to track the performance of the United States stock market. The index covers the 500 largest companies by market capitalization. This represents a little over 80% of the total capitalization of the U.S. stock market. These companies vary widely across the sector spectrum, covering both manufacturing and service companies.
Russell 2000
The Russell 2000 is used to track the performance of smaller companies in the United States. It tracks the roughly 2000 securities considered to be among the smallest US companies. It is a capitalization-weighted index made up of the smallest 2,000 U.S. common stocks as measured by market capitalization included in the Russell 3000 Index, which consists of the largest 3,000 U.S. common stocks based on market capitalization. There are between 3700 and 3800 listed companies on U.S. exchanges right now, so the Russell 3000 covers more than 99% of total U.S. market capitalization. This gives you some idea of how small the smallest 700-800 companies must be.
MSCI ACWI Ex-US
The MSCI All Country World Index Ex-US is used to track the performance of stock markets around the world, excluding the United States. It captures large and mid-cap representation across 22 or 23 Developed Markets (DM) countries (excluding the US) and 25 Emerging Market (EM) countries. With 2,300 constituents, the index covers approximately 85% of the global equity opportunity set outside the US.
Bloomberg US Aggregate Bond Index
The Bloomberg US Aggregate Bond Index is used to track the performance of the United States investment grade (BBB-rated or higher) bond market. It is a broad-based benchmark that measures the investment grade, US dollar-denominated, fixed-rate taxable bond market. The index includes Treasuries, government-related and corporate securities, MBS (agency fixed-rate pass-throughs), ABS and CMBS (agency and non-agency). In May 2019, 72% of all U.S. bonds were investment grade. This number fluctuates due to economic conditions and investor preferences.
Over the course of 17 days (March 6th to March 23) the market discounted the absolute worst-case scenario and then began to walk it back, slowly at first and then rapidly by June.
Disclosure
Past performance is no assurance of future results. Trademark Financial Management, LLC (“Trademark”) is a registered investment adviser with its principal place of business in the State of Minnesota. Trademark and its representatives are in compliance with registration requirements imposed upon investment advisers by those states in which Trademark operates. Trademark may only transact business in those states in which it is registered or qualifies for an exemption or exclusion from registration. This newsletter is limited to the dissemination of general information pertaining to its investment advisory/management services. Any subsequent, direct communication by Trademark with a prospective client shall be conducted by a representative that is either registered or qualifies for an exemption or exclusion from registration in the state where the prospective client resides. A complete list of all recommendations will be provided if requested for the preceding period of not less than one year. It should not be assumed that recommendations made in the future will be profitable or will equal the performance of the securities in this list. Opinions expressed are those of Trademark Financial Management and are subject to change, not guaranteed and should not be considered recommendations to buy or sell any security. For information pertaining to the registration status of Trademark please contact Trademark at (952) 358-3395 or refer to the Investment Adviser Public Disclosure web site (www.adviserinfo.sec.gov).
For additional information about Trademark, including fees and services, send for our disclosure statement as set forth on Form ADV from us using the contact information herein or by calling 952-358-3395. Please read the disclosure statement carefully before you invest or send money. Any reference to a chart, graph, formula, or software as a source of analysis used by Trademark Financial Management staff is one of many factors used to make investment decisions for your portfolio. No one graph, chart, formula, or software can in and of itself be used to determine which securities to buy or sell, when to buy or sell them, or assist any person in making decisions as to which securities to buy or sell or when to buy or sell them. Any chart, graph, formula, or software used is limited by the data entered and the created parameters. The data was obtained from third parties deemed by the adviser to be reliable. Nonetheless, the adviser has not verified the results and cannot be assured of their accuracy.
The stock market shrugged off several attempts at a broad sell-off last quarter to eventually end up about 11% higher. Both November and December saw drawdowns of more than three percent before sharp reversals led to new all-time highs. Of course, this is only true if we consider the largest U.S. companies as “the stock market”. If I were describing last quarter’s performance by small and mid-size companies, I could have written the following: “the stock market ran up sharply in October only to decline even faster in November. A modest early December rebound quickly failed as did a late December bounce. The Russell 2000 small cap stock index gained only 2.1%1 on the quarter”. Likewise, discussion of international stocks would have looked strikingly similar; a lot of choppiness and a modest gain (up 2.7%). The utterly massive performance of just a few stocks has distorted everything. Semiconductor chip-making powerhouse Nvidia was up 42%2 last quarter, while Tesla soared 36%, Apple 26%, and Microsoft just under 20%. Mega-cap health juggernaut UnitedHealth Group rose 29% and Home Depot climbed 27%. More on this below.
Bonds continued to struggle in the face of rising interest rates. The Bloomberg Aggregate Bond Index gained exactly 0.01%, which lifted its return for the full year from -1.55% to -1.54%3. Ouch. By reducing interest sensitivity, either through buying shorter maturity bond or lower credit debt, it was possible to reduce or eliminate losses in a bond portfolio, but even the very best bond category still paled in comparison to most stocks. The positive in terms of bond ownership is that as yields rise, newly issued bonds have higher coupons. That means future bond market returns should improve.
European stocks were the next best performers last quarter, gaining 5.1%.4 China continued to drag Asia lower. China lost a little over 6% as investors continued to question Chinese economic policies and the real estate sector was reeling from the Evergrande crisis. Japan also fell almost 4%, but international analysts tend to regard that country as very cheap. It is easy to write off non-U.S. markets because of their poor relative performance over the past decade, but investors cannot invest in past returns. Going forward, the vast valuation discrepancies in foreign based stocks versus U.S. stocks make foreign markets attractive – if not immediately then at least on a 5-10 year basis.
Activity
We have been more active lately as financial markets show signs of succumbing to the pressure of rising interest rates. When interest rates rise, several things happen:
1. Existing bonds decline because their coupons become less attractive relative to new bonds with higher coupons;
2. Stocks decline, because the value of their future dividends and/or future cash flows are worth less when discounted to the present; and
3. Gold may also worth less if interest rates increase faster than underlying inflation, such that they (interest rates) more fairly compensate investors from inflation.
As investors, we really don’t want to see inflation. It is almost never helpful. The problem is, if interest rates are kept artificially low, inflation eventually results. For years the Fed has kept inflation largely confined to the stock and real estate markets. The Covid crisis ended this, because the pandemic forced production shutdowns because of the unavailability of labor and/or materials. The obvious consequence of scarcity of materials and labor is higher prices and wages.
In bond portfolios we have been reducing interest rate sensitivity by exchanging into shorter duration bonds with higher yields. In some instances, we have substituted alternatives such as convertible or merger arbitrage for some of our bond exposure. In stock portfolios we have reduced exposure to the highest volatility stock positions. For the most part these were funds that focused on disruptive technologies which, while promising, will generate most of their profits in the distant future and as such cannot be valued as highly when interest rates are rising.
Outlook
What we’ve seen so far in January is either a needed correction that will set the stage for the next leg of rally once interest rates stabilize, or evidence that the speculative post-covid liquidity bubble has popped in which case stocks will not stop falling until all the speculative excess has been wrung out. Corrections caused by excessive valuation running into more restrictive monetary policy are not rare – we saw two in 2018 and one in each of the preceding eight years (except 2013 and 2017). Full fledged paradigm shifts tied to a crisis in one or multiple sectors of the economy are far more rare, and indeed, not what we expect this time either. Still, it can be unpleasant to go through these periodic downturns.
We are seeing some very strong companies starting to be sold off lately. We didn’t take it as a general warning when some of the highest post-Covid flyers like Zoom and Roku and Zillow ran into trouble last year because they are not very representative of the market as a whole. If a correction would come along that impacted Apple, Microsoft, Nvidia, Adobe, and the like – then you’d know investors were finally starting to care about inflation. That is where we stand today. Again, I believe this dip will be bought much like the others in this long bull market. The economy isn’t slowing at this point and interest rates are still low (the 10-year bond still yields less than 2%). Again, I believe this decade we will see a paradigm shift that causes U.S. interest rates to move to a higher range and makes non-U.S. assets more attractive, but this will take years to evolve.
Commentary
One good thing about analyzing very large companies like Apple, Microsoft, and Nvidia with hindsight is that you can say conclusively that none of them deserved their huge stock price surge. Their size is such that their profits could not possibly have grown fast enough to justify a 20% quarterly gain on top of their gains of the first three quarters of 2021. If we know, therefore, that the prices of U.S. mega-caps are not justified by their economic performance, why are they so high? Because they have pulled in capital from all over the globe seeking growth and safety in a world where growth has largely (but not exclusively) been confined to American companies and safety has meant that the earnings yields on blue chip U.S. companies (even with price-to-earnings ratios above 35) exceed what one could earn from the bond market, many regarded them as being bond substitutes. Years ago we even coined an acronym – TINA – for the idea that as far as U.S. stocks are concerned, There Is No Alternative.
Over the past decade or so, U.S. investors have been rewarded for behaving as if there was no alternative to U.S. stocks. It is my belief, however, that the “TINA Era” is in the process of ending. Imagine the Pacific Ocean at rest. Waves aren’t cresting in Japan, nor are they high in Oregon, Peru, or Australia. Now imagine the strongest hurricane force winds ever recorded blowing due northeast. The entire Pacific Ocean is being pushed toward the U.S. west coast, hard. The hurricane in this allegory is the combined forces of U.S. economic and taxation policy (a 40-year shift in tax policy away from corporations and toward individuals, chart 2), the U.S. dollar’s global reserve currency status, and the global oil payment system. All of this combines to drive money into the U.S. stock market and especially to biggest and the most liquid companies therein. The winds may fluctuate in intensity, but they never completely let up, so the world gets used to what would normally be regarded as very unusual circumstances. The U.S. dollar is expensive relative to all other currencies because everyone needs it to buy oil and U.S. equities (which have been at multi-decade highs, at least until recently).
Americans are disproportionally enriched by this system, which allows them to consume more and more, which makes their trade deficit with the rest of the world larger and larger (see Chart 1). The catch is this – the benefits to Americans are not evenly distributed. For the most part they are realized by stockholders, so the wealthiest get ever wealthier. Over time, the U.S. has developed a wealth gap that is more befitting a third world country (see Chart 3). At least somewhat as a result of this, our political system is as fragmented and contentious as it has been since the Civil War. This decade cannot, and I believe will not, just be more of the same, because a rising percentage of younger (and statistically poorer) people don’t believe the systems works for them. As economist Herbert Stein once said, “If something cannot go on forever, it will stop”.
Change is always difficult to forecast. On any given day, odds are that politically, economically, socially, and geologically things will change very little from the previous day. Then there are those days where something snaps and everything changes. In light of the extreme level of imbalances, it seems prudent to begin to invest as though there are alternatives and to use them more actively, rather that wait for market conditions to force this upon us. No one is going to ring a bell to tell investors that the great TINA era is over, but at some point in the future we will all know that it is. As I said in the Outlook, I expect a near term rally off last Friday’s (1/21/22) lows, but I also expect a more difficult decade for investors than the 2010s were.
[1] U.S. Index performance courtesy of S&P 500 via Morningstar Workstation ↩︎
[2] U.S. individual stock performance courtesy of Morningstar Workstation ↩︎
[3] Bond index performance courtesy of Bloomberg via Morningstar Workstation ↩︎
[4] International Index performance courtesy of MSCI Global via Morningstar Workstation ↩︎
Disclosure
Past performance is no assurance of future results. Trademark Financial Management, LLC (“Trademark”) is a registered investment adviser with its principal place of business in the State of Minnesota. Trademark and its representatives are in compliance with registration requirements imposed upon investment advisers by those states in which Trademark operates. Trademark may only transact business in those states in which it is registered or qualifies for an exemption or exclusion from registration. This newsletter is limited to the dissemination of general information pertaining to its investment advisory/management services. Any subsequent, direct communication by Trademark with a prospective client shall be conducted by a representative that is either registered or qualifies for an exemption or exclusion from registration in the state where the prospective client resides. A complete list of all recommendations will be provided if requested for the preceding period of not less than one year. It should not be assumed that recommendations made in the future will be profitable or will equal the performance of the securities in this list. Opinions expressed are those of Trademark Financial Management and are subject to change, not guaranteed and should not be considered recommendations to buy or sell any security. For information pertaining to the registration status of Trademark please contact Trademark at (952) 358-3395 or refer to the Investment Adviser Public Disclosure web site (www.adviserinfo.sec.gov).
For additional information about Trademark, including fees and services, send for our disclosure statement as set forth on Form ADV from us using the contact information herein or by calling 952-358-3395. Please read the disclosure statement carefully before you invest or send money. Any reference to a chart, graph, formula, or software as a source of analysis used by Trademark Financial Management staff is one of many factors used to make investment decisions for your portfolio. No one graph, chart, formula, or software can in and of itself be used to determine which securities to buy or sell, when to buy or sell them, or assist any person in making decisions as to which securities to buy or sell or when to buy or sell them. Any chart, graph, formula, or software used is limited by the data entered and the created parameters. The data was obtained from third parties deemed by the adviser to be reliable. Nonetheless, the adviser has not verified the results and cannot be assured of their accuracy.
Summary
While it is technically true that the S&P 500 stock index added 0.58% in the third quarter, it really didn’t feel that way. Small cap U.S. stocks declined, midcap U.S. stocks declined, and foreign stocks declined – both developed and emerging markets. Seven of the largest ten stocks in the U.S. advanced, led by Alphabet, Tesla, and Microsoft, which was enough to turn the major index positive despite most stocks losing ground. For most companies and countries, however, the big news on the quarter was the surge in inflation caused by significant supply disruption, both of goods and of services. The world continues to emerge from the Covid crisis, but mostly in fits and starts. The global economy that is emerging seems to be profoundly different than the one we had before. That said, the Federal Reserve has maintained a very accommodative monetary policy, so enough liquidity exists to allow the market to “tread water” more or less. Inflation may be rising, but companies seem to be able to pass on their higher costs because their customers are in better financial shape. That means corporate profit margins can remain at or near all time highs. Whether one believes Fed policy has been wise or not, this is not the environment in which one should expect a major decline.
The first two months of the third quarter were marked by a concern that the economy was slowing. Utilities, real estate, and communications, three of the most defensive sectors, performed the best while those that are the most economically sensitive – energy, materials, and industrials – lagged. September saw a surge in energy prices amid a pickup in the economy, so the roles reversed. Financial services stocks had the best quarter of all in that very low interest rates promote the “game-ification” of financial markets. With IPOs, mergers, and other financial activities at record levels, there were nice fees for Morgan Stanley, Goldman Sachs, and their peers.
Emerging markets drew most of the attention this past quarter. Everybody was trying to determine whether China was still a reasonable place to invest with all the new regulations imposed by Xi Jinping. China’s -13.34% quarterly return dragged the MSCI All Emerging Markets index to a -8.09% loss. International stocks as a whole were only down -3.02%, because Japan gained 4.56% and Europe and Canada were only modestly lower. The best performing international stocks last quarter were actually in what are known as frontier markets. This encompasses countries in Asia, Africa, South America, and eastern Europe that do not qualify for EM status. Think places like Columbia, Nigeria, Qatar, Austria, and Vietnam.
Bonds were about unchanged last quarter. Yields are very low, but until recently they have been relatively stable. Low prospective returns have led many investors to take the extra risk of high yield corporate, floating rate, high yield municipal, or emerging market debt in order to earn higher income. In all cases but the latter, it paid off during the third quarter. With interest rates rising this quarter, taking that extra credit risk may pay off again this quarter. The risk in doing so is a sudden economic downturn which increases fears of default, but I just don’t see that happening in the near term.
Activity
Because the biggest concern this quarter was emerging markets (China most specifically), that was the area we spent the most time on. We reduced exposure to China either by trimming the overall emerging market weighting or by exchanging to an emerging market fund with a lower percentage of Chinese stocks. One didn’t want to avoid emerging markets altogether, because some countries (India, for example) performed quite well. We also had to address rising inflation and its impact on the bond market. The largest moves were in shorter duration bonds. Short term bond yields are so low that even fairly small interest rate increases can cancel out all the income one receives. We’ve been replacing some of our bond exposure with lower risk securities with less interest rate sensitivity, such as market neutral and convertible arbitrage funds. We’ve also been adding a small amount of commodity exposure to many portfolios. Lastly, we continued to reduce exposure in some of the areas that made us a lot of money in 2020 but have spent most of this year working off over-valuation. Funds (ETFs) focusing on genomics, clean energy, and emerging technologies have struggled this year, so we have reduced our exposure to these more narrowly focused areas.
Outlook
The stock market’s -4.65% decline in September spooked a few people, but we expected a pullback due to the frenetic pace of new highs throughout the summer and the fact that the September to mid-October period tends to be a seasonally weak time for stocks. Fortunately, this October has gotten off to a good start. Increasingly, the market volatility that one associates with October actually occurs in September, so once we get to the start of earnings season in mid-October, we are usually “out of the woods” so to speak. We can’t predict exactly when the market will get over its September funk in any given year, so we tend to avoid seasonal trading. That said, we were not at all surprised when stocks made new all-time highs on October 21st.
We believe that earnings season will continue to provide a boost to most stocks as corporate profit margins remain at or near record levels. The next period of caution will arrive right before the Federal Reserve meeting on November 2-3. The Fed is expected to announce a modest tapering in bond purchases, which would remove some of the very ample liquidity from the market. An announcement of a greater than expected tapering would almost certainly adversely affect both stocks and bonds, but Chairman Powell seems keen not to roil the markets the way he did in late 2018.
Commentary – It’s What You Know For Sure That Just Ain’t So
Mark Twain had a number of wonderful and witty sayings. “Kindness is a language which the deaf can hear and the blind can see”, and “God created war so that Americans would learn geography” are two of my favorites. His quote, “It ain’t what you don’t know that gets you into trouble, it’s what you know for sure that just ain’t so” is probably the one with most relevance to investors. Twain seems to have understood overconfidence bias some 80 years before Daniel Kahneman and Amos Tversky won a Nobel Prize for analyzing people’s behavioral biases. In the thirty-five years since I started in the financial services industry (yes, in 1986) nothing has cost people more money than the attempt to sidestep market declines because they just knew that the market was about to go down.
I am not saying that timing the market is impossible because that is obviously not true – those who try are occasionally successful. Great market calls are so rare though that we tend to remember the names of the very few who made them. Jesse Livermore, Elaine Garzarelli, and Michael Burry come to mind. I am instead saying that market timing is a low probability exercise. Selecting both a favorable time to exit and then an auspicious time to re-enter the market is very difficult. Despite more than a century of attempts, nobody has found an indicator robust enough not to give false signals timely enough to warn you before the market is already down more than 10%. Professionals talk about “batting average” because they know NOBODY gets every trade right. Non-professionals often believe that there are those who get all the big moves right, because the advertisements on the internet tell them so.
One of the worst mistakes non-professionals make is believing that the fate of markets lies with who is in the White House. The fact of the matter is that stock performance depends primarily on corporate profits (both current and expected), the future rate of inflation (because inflation reduces the value of a dollar earned in the future), and the amount of liquidity provided by the Federal Reserve that companies, investors, and speculators may use to leverage up their return. For example, Apple Inc. generates billions of dollars in free cash flow every quarter. It does not need to borrow money in the bond market to fund its operations, but it does so anyway in order to buy back some of its shares. This increases the reported earnings per share because Apple’s growth rate is higher than it’s cost of borrowing. If the Fed holds borrowing costs low enough, even very mediocre companies with much lower returns on capital can take advantage of this form of arbitrage. That is what we are seeing today. It’s gone on since the Great Financial Crisis, and it has largely contributed to the twelve-year bull market that began in March 2009. Presidents do not control how much liquidity is in the economy, at least not directly, therefore they tend to get too much credit or blame for stock market movements. Companies focus on serving their customers and growing their businesses, regardless of who is in the White House. No particular policy of the Biden administration, the Trump administration, or the Obama administration before that was the catalyst responsible for the bull market.
There is an old saying on Wall Street – “the trend is your friend until the bend at the end”. This is a clever way of saying that all trends, including this one, will eventually end, but the smart money respects it and doesn’t constantly try to “front run” the ending. Bull markets do not end because prices get too high, rather they die because the fuel that propelled them to the high prices has been exhausted. Leverage is wonderful on the way up but disastrous on the way down. Knowing this forces us to carefully watch liquidity conditions, inflation, and corporate profit margins to get a hint at when we might shift to a more defensive posture. Not because we think we can avoid the next market crash, but that we may be less exposed when one does come.
Mark Twain also wrote: “October: This is one of the peculiarly dangerous months to speculate in stocks. The others are July, January, September, April, November, May, March, June, December, August, and February”. Humor aside, every day we think hard about what might go wrong and how this bull market may end. Stocks are by almost every measure quite expensive, inflation appears to be on the rise, and at some point the Federal Reserve will not be able to be this accommodative. That said, the bull market has overcome many challenges over the past several years and has therefore earned the benefit of the doubt. That is we try very hard not to let our concerns cause us to give up a meaningful amount of return potential.
One thing I’ve learned is that all large market declines start out as little market declines, but the vast majority of little market declines do not turn into crashes. Crashes happen when the initial problem is not handled right. You can’t predict policy errors or market panic in advance.
S&P 500 performance from Standard & Poor’s via Morningstar
Sector performance information via JPMorgan
Foreign stock performance from MSCI International (Morgan Stanley), via Morningstar
S&P 500 return, again courtesy of Standard and Poor’s.
Disclosure
Past performance is no assurance of future results. Trademark Financial Management, LLC (“Trademark”) is a registered investment adviser with its principal place of business in the State of Minnesota. Trademark and its representatives are in compliance with registration requirements imposed upon investment advisers by those states in which Trademark operates. Trademark may only transact business in those states in which it is registered or qualifies for an exemption or exclusion from registration. This newsletter is limited to the dissemination of general information pertaining to its investment advisory/management services. Any subsequent, direct communication by Trademark with a prospective client shall be conducted by a representative that is either registered or qualifies for an exemption or exclusion from registration in the state where the prospective client resides. A complete list of all recommendations will be provided if requested for the preceding period of not less than one year. It should not be assumed that recommendations made in the future will be profitable or will equal the performance of the securities in this list. Opinions expressed are those of Trademark Financial Management and are subject to change, not guaranteed and should not be considered recommendations to buy or sell any security. For information pertaining to the registration status of Trademark please contact Trademark at (952) 358-3395 or refer to the Investment Adviser Public Disclosure web site (www.adviserinfo.sec.gov). For additional information about Trademark, including fees and services, send for our disclosure statement as set forth on Form ADV from us using the contact information herein or by calling 952-358-3395. Please read the disclosure statement carefully before you invest or send money. Any reference to a chart, graph, formula, or software as a source of analysis used by Trademark Financial Management staff is one of many factors used to make investment decisions for your portfolio. No one graph, chart, formula, or software can in and of itself be used to determine which securities to buy or sell, when to buy or sell them, or assist any person in making decisions as to which securities to buy or sell or when to buy or sell them. Any chart, graph, formula, or software used is limited by the data entered and the created parameters. The data was obtained from third parties deemed by the adviser to be reliable. Nonetheless, the adviser has not verified the results and cannot be assured of their accuracy.
Summary
Stocks maintained their strong advance in 2021 by adding another 8.55% last quarter. Technology, Energy, and Real Estate led the way. Economically, that makes little sense – technology, as a long-dated asset, should benefit from disinflation while energy (a cyclical) should respond to economic strength and higher inflation. The Telecom and Utility sectors are usually viewed as defensive because people generally don’t use less electricity or phone service during a recession. Here too performance varied widely; telecoms rose 10.72% last quarter while utilities lost 0.41%. Rather than flowing in one particular direction in response to a coherent Federal Reserve policy, money in the market is sloshing around haphazardly. Attributing any given day’s results to a particular concern, such as COVID or China or inflation, is giving traders way too much credit.
Source: JPM Guide to the Markets 3Q 2021. The Fed’s balance sheet expansion lifts stocks after the Great Financial Crisis and again after the COVID Crisis
The Federal Reserve continues to pump money into the financial system by buying bonds. This is depressing yields, forcing income-seeking investors to opt for riskier securities if they do not want to settle for historically low yields. All of the Fed’s buying doesn’t do bond investors much good in the long run. A decade of central bank bond buying has all but ensured that inflation levels will exceed the yields of high quality bonds. Today, the bond market yields less than 2%. Given that inflation is currently around twice that, bond investors receive about a -2% annual return in purchasing power terms. Even without factoring in inflation, the U.S. Aggregate Bond Index has delivered a -1.60% loss through the first half of 2021. Some bond investors have migrated to riskier high yield “junk” bonds which have returned 3.62% so far this year, while others have embraced dividend paying stocks. One hopes they remember that in the last real bear market (2007-09) quality bond losses tended to be well under -10% (in fact long treasuries actual rose), while high yield bonds and dividend paying stocks each lost more than a third of their value. The market has an expression for taking large risks to obtain modest returns – picking up pennies in front of a steamroller. That pretty much sums it up.
Switching to foreign markets, foreign stocks were again rather subdued compared to the U.S. Developed foreign markets gained 5.69% and emerging markets rose 6.08%, according to S&P Dow Jones. Both indices are up less than 10% year to date. Japan has been notably weak, while Canada has strung together two straight quarters of 10% plus gains on the strength of soaring lumber and energy prices. China’s crackdown on its technology leaders has been a drag on Asian and emerging market indices because these stocks are some of the largest components.
Gold has had a rough half year so far as the dollar has been strong, but commodities in general have been having one of their best years in a decade. Energy and agricultural commodities have led the way. With inflation posting some of its strongest numbers in years, this area has become more interesting to us. We are looking at ways to hedge inflation that don’t involve gold or inflation-indexed bonds.
Activity
There was not as much trading activity this quarter, as the narrative driving both the bond and stock markets remained largely unchanged. We review portfolios on an ongoing basis to see if there are any funds or ETFs that are underperforming such that we could replace them with better performing alternatives and not expose the portfolio to greater concentration risk. At the margin we have reduced the weighting in cash and bonds and increased the percentage allocated to stocks, but we are conscious that we (and the market as a whole) have been forced to pay ever higher prices for the hope of future returns. Steamroller indeed.
There has been a very sharp correction in the more aggressive sectors of the market – cryptocurrencies and cutting-edge industries like electric vehicles, genomics, financial technologies, and cloud-based consumer technologies. We don’t have much exposure to these areas, but to the extent that we do, we are riding it out. One must expect a much higher level of volatility if one hopes for significantly greater return. Again, money moves in and out of these stocks so fast that a tactical approach (timing) just doesn’t work.
Outlook
From time to time, there will be “corrections”. Volatility is a part of investing, such that if you aren’t comfortable with the occasional 5%-10% decline, perhaps you are more of a saver than an investor. That said, once a decade or so the stock market undergoes a more significant decline (30% or more) usually tied to either a sharp fall in economic output or a sharp rise in costs (inflation). Ex-post, market corrections associated with either of those causes may be correlated with an inverted yield curve or an abnormal advance-decline ratio. On the other hand, the “crashes” of March 2020 and October 1987 fall into the category of event-driven sell-offs, where one does not get much of an early warning.
Investing can be broken down into macro (asset allocation) and micro (individual security selection). Much of the macro part of investing is trying to identify those times in which the risk of a more significant decline is elevated. When those conditions are present, investors should re-assess their asset allocation. Most of the time that risks are elevated the market will undergo a modest correction but then the upward trend will promptly re-establish itself. In these cases, taking no action will have been the better strategy. The longer the market goes without a major decline, however, the more valuation and sentiment can get way out of whack and the odds of a major market event rise. Theoretically, the sharp plunge sixteen months ago should have put us in a place where we would not have to worry about excess speculation for several years. As we all know, however, speculation has come back with a vengeance. Stock prices have about doubled off their March 23rd low.
The stock market doesn’t peak because valuations reach 20 times earnings or 18 times sales or 5 times book value or any other accounting metric. Instead, markets peak when investors begin to worry that they won’t be able to find other investors to sell to at higher prices. Therefore, it is important to be able to sense when the market (or a segment of it) is approaching its saturation point. As I stated above, we appear to have reached that point earlier this year with Bitcoin and other cryptocurrencies and with companies that fit the “disruptive technologies” description. Hopefully that is all the correction we will get for now, but I find it difficult to believe that we are going to get off that easy. That said, we have not yet positioned our portfolios for a more serious decline. Risk on, but watching closely.
Commentary
When I started in the financial services industry in 1986, the Federal Reserve was in the process of bringing interest rates down from the mid-teens. It had been necessary to hike rates to 16% or so back in 1981 in order to crush inflation. By 1986 rates had fallen to around 10% as inflation retreated into single digits. The Fed never seemed to be able to go two straight meetings without changing the discount rate, because fears of returning inflation seemed to conflict with fears of economic slowdown. This tug of war served active investors very well – if you could correctly anticipate the Fed’s next move in time to position yourself accordingly, you could expect to make a greater-than-market-return profit. The dynamism of interest rates and the business cycle drove investment decision.
Today everything is different. The Federal Reserve is basically stuck on zero percent. There is no business cycle to speak of, because the Fed is trying (through its open market activities) to maintain a perpetual state of early-to-mid cycle. This encourages a more passive approach to investing. If you imagine a bathtub where the Fed is filling the tub while investors thrash around like a three year-old, active investing is essentially betting on which areas of the tub will see higher or lower water levels, while passive investing is betting on the overall water level. Since the 2007-09 financial crisis, a succession of Fed governors have made the latter virtually a slam dunk.
In this environment, very few major companies ever go bankrupt relative to 30 or 40 years ago because interest rates are much lower and most companies of any size have access to credit. Of course, their stock and bond prices have risen to reflect their much lower degree of economic risk. The problem is, if the Fed ever stops pumping money into the economy through the purchase of government and corporate debt, interest rates are likely to rise. This means credit won’t be as easy to obtain and more companies will fail and therefore risk premiums will have to rise. In other words, stock and high yield bond prices will fall. If you recall, the Fed tried to end this process back in October 2018 and the 4th quarter of that year was rather ugly for investors.
Why, you might ask, would the Fed ever stop pumping liquidity into the market if doing so would cause a market decline? One reason is that not everybody in an economy is an investor. Some only have the means to be a saver. Because the Fed is keeping interest rates artificially low, savers get less interest than they should. In essence, savers are subsidizing investors. This helps increase wealth inequality across classes, and history suggests that rising wealth inequality ultimately does not end well. At some point (probably during the next recession), the idea of stimulating the economy through Fed purchases is likely to become politically unpopular (the bottom 50% of the income spectrum owns such a tiny percentage of the stock market that it’s almost impossible to perceive on a line graph).
Things have changed a lot over the past 40 years. The way one reads the market and the tactics one uses to maximize return for a given level of risk have certainly changed. As a result, our methods have evolved to the use of more passive vehicles like ETFs and now, rather than anticipate the Fed’s next move, we start from the default position that the Fed is not going to change its tactics unless it absolutely must. That day will come, but it is not going to be tomorrow and it is probably not going to be for quite a while. When it comes, advisors and investors will face a new environment and new tactics will have to de devised. It is our mission to guide you through that as smoothly as we can.
Meaning that almost all potential buyers are already in.
Incidentally, I am not worried about the stock market effects of a resurgence of COVID. I do not foresee the country shutting down like it did last year. America has collectively decided that it is going to stay open and deal with the consequences.
Per S&P Dow Jones Indices
1.97% as of Today per YCharts (Vanguard Total Market Bond ETF)
It’s even worse if you own CD’s that yield 1% or less
S&P Canada Broad Market Index Total Return in US dollars, per Morningstar Workstation
Disclosure
Past performance is no assurance of future results. Trademark Financial Management, LLC (“Trademark”) is a registered investment adviser with its principal place of business in the State of Minnesota. Trademark and its representatives are in compliance with registration requirements imposed upon investment advisers by those states in which Trademark operates. Trademark may only transact business in those states in which it is registered or qualifies for an exemption or exclusion from registration. This newsletter is limited to the dissemination of general information pertaining to its investment advisory/management services. Any subsequent, direct communication by Trademark with a prospective client shall be conducted by a representative that is either registered or qualifies for an exemption or exclusion from registration in the state where the prospective client resides. A complete list of all recommendations will be provided if requested for the preceding period of not less than one year. It should not be assumed that recommendations made in the future will be profitable or will equal the performance of the securities in this list. Opinions expressed are those of Trademark Financial Management and are subject to change, not guaranteed and should not be considered recommendations to buy or sell any security. For information pertaining to the registration status of Trademark please contact Trademark at (952) 358-3395 or refer to the Investment Adviser Public Disclosure web site (www.adviserinfo.sec.gov). For additional information about Trademark, including fees and services, send for our disclosure statement as set forth on Form ADV from us using the contact information herein or by calling 952-358-3395. Please read the disclosure statement carefully before you invest or send money. Any reference to a chart, graph, formula, or software as a source of analysis used by Trademark Financial Management staff is one of many factors used to make investment decisions for your portfolio. No one graph, chart, formula, or software can in and of itself be used to determine which securities to buy or sell, when to buy or sell them, or assist any person in making decisions as to which securities to buy or sell or when to buy or sell them. Any chart, graph, formula, or software used is limited by the data entered and the created parameters. The data was obtained from third parties deemed by the adviser to be reliable. Nonetheless, the adviser has not verified the results and cannot be assured of their accuracy.