U.S. stocks rose 10.4% in April. The rally was triggered by the March 30th announcement that the U.S. would not invade Iran nor try to obliterate it. Relieved, investors began to buy back stocks and this buying has created its own momentum like in April 2025. The problem is that unlike last year with tariffs, the threat hasn’t really gone away and oil prices (futures) continue to price in a longer conflict. The 30-year Treasury Bond briefly hit 5%. Rising interest rates, rising oil prices and a sustained stock bull market are NOT mutually compatible. I don’t know how or when or from what level this ends (it could be much higher if we have mania tied to the IPOs of SpaceX and a couple major AI players), but I don’t think this year will end with the same 20%-ish gains as the past three years.
Earnings Growth — Strong but Accounting-Driven
Earnings growth has been very strong in the first quarter of 2026. That said, it is important to note that much of the growth is accounting-driven. The OBBBA or One Beautiful Bill accelerates write-offs among other things, as opposed to growth driven by demand volume. First quarter GDP was just reported at a fairly modest 2.0%.
In January I felt that a domestic-to-foreign stock ratio of 69%:31% was appropriate, noting that the dollar was trending weak, foreign markets were less expensive, and capital expenditures were really set to rise in developed markets ex-US. Today, because of the Iran situation and the indefinite blocking of the Straits of Hormuz, I would be more like 72%:28%. There is no getting around the fact that the present situation with respect to the cost of oil is more painful ex-US than it is here. The flip side of this is that if you asked me where I thought I’d be five years from now, I’d have probably said somewhere around 65%-67% US whereas now I’d say 62%-64% U.S. The developed world plus EM Asia will not forget that the U.S. in 2026 made decisions that only favored itself and Israel. (Read also: Our March 2026 Update)
Interest Rates — 30-Year Bond at 5%
It is significant that the 30-year bond is flirting with 5%. It will be even more significant if the 10 years breaches 4.5% and stays above it.
Notable Reads This Month
From Main Street Alpha “We are transitioning from a globalist, low-inflation environment, where tech multiples could expand to the moon on the back of zero-interest-rate policy to a nationalist, high-nominal growth era. If the regime is shifting toward nominal growth and persistent inflation, the biggest winners won’t be the innovators. The biggest winners will be… the monopolistic.”
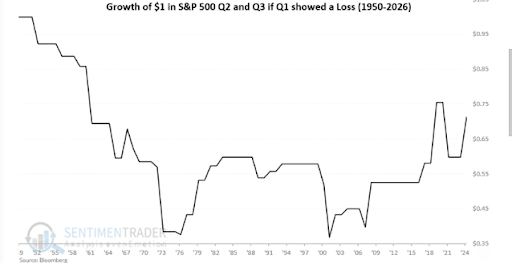
From Sentimentrader: Since 1950, the stock market has shown a collective loss in the middle of the year (April 1-September 30), though it has improved lately
From Howard Marks (Oaktree) on the value of being consistently above average: “I had dinner with the CIO of a pension fund. He explained that in his 14 years on the job, his fund had never been above the 27th percentile or below the 47th percentile. It was solidly in the second quartile of pension funds. As a result, for 14 years, he was in the fourth percentile”.
From Roy Amara on why new technologies are often priced wrong: “people tend to overestimate the short-term impact of new technologies while underestimating their long-term effects.”
From Ford CEO Jim Farley via Cedar Owl: “We cannot fill 5,000 mechanic jobs even at $120,000 per year”. This is not a wage problem. It is a structural training and cultural problem that cannot be solved by tariffs or subsidies.
DISCLOSURE
Past performance is no assurance of future results. Trademark Financial Management, LLC (“Trademark”) is a registered investment adviser with its principal place of business in the State of Minnesota. Trademark and its representatives are in compliance with registration requirements imposed upon investment advisers by those states in which Trademark operates. Trademark may only transact business in those states in which it is registered or qualifies for an exemption or exclusion from registration. This newsletter is limited to the dissemination of general information pertaining to its investment advisory/management services. Any subsequent, direct communication by Trademark with a prospective client shall be conducted by a representative that is either registered or qualifies for an exemption or exclusion from registration in the state where the prospective client resides. A complete list of all recommendations will be provided if requested for the preceding period of not less than one year. It should not be assumed that recommendations made in the future will be profitable or will equal the performance of the securities in this list. Opinions expressed are those of Trademark Financial Management and are subject to change, not guaranteed and should not be considered recommendations to buy or sell any security. For information pertaining to the registration status of Trademark please contact Trademark at (952) 358-3395 or refer to the Investment Adviser Public Disclosure web site (www.adviserinfo.sec.gov). For additional information about Trademark, including fees and services, send for our disclosure statement as set forth on Form ADV from us using the contact information herein or by calling 952-358-3395. Please read the disclosure statement carefully before you invest or send money. Any reference to a chart, graph, formula, or software as a source of analysis used by Trademark Financial Management staff is one of many factors used to make investment decisions for your portfolio. No one graph, chart, formula, or software can in and of itself be used to determine which securities to buy or sell, when to buy or sell them, or assist any person in making decisions as to which securities to buy or sell or when to buy or sell them. Any chart, graph, formula, or software used is limited by the data entered and the created parameters. The data was obtained from third parties deemed by the adviser to be reliable. Nonetheless, the adviser has not verified the results and cannot be assured of their accuracy.
Market Update
1. Exactly a month ago, Europe was outperforming the U.S. year-to-date by over 7% (8.2% to 1.1%). Today that spread is less than 2% (-4.4% to -6.2%). As bad as things have been here in March, overseas it has been worse (except for Latin America). Asia saw their 14% rally erode, settling with only a 1.5% gain. A lot of this is currency, but if you are a company and your energy costs are up 50% or more, your profit outlook has taken a substantial hit.
2. So far, credit spreads have stayed fairly tight. For all the hand-wringing about private credit woes, investors are not even bailing on CCC-rated bonds yet, let alone the BBs and Bs that most high yield and strategic income funds own. Credit holders are not panicking. This suggests that if we were able to contain the Iran/Straits of Hormuz situation before too long (say, mid-April) that the economy would be okay.
3. The biggest stock “carnage” continues to be in the growth/technology area. Software-as-a-Service still can’t find a bottom, and weakness is spreading to other areas of the tech sector. Even semiconductors (the leading tech sub-sector) are now more than 10% below their February 25 highs. Value stocks, because of their exposure to Energy, Utilities, and Consumer Staples, are still positive YTD. Value would be stronger if one excludes the Financial Services sector, which is off 10%. Stocks seldom do well as a whole when financial stocks are lagging this badly.
4. The 200-day simple moving average of the S&P 500 is 6616. The index is now flirting with 6400. The 200-WEEK moving average is at 6425, so we will probably see a rally attempt around current levels. A failure to hold 6400 might send us fairly quickly to the 6100 area.
5. Gold made its high on January 29th. Its move was parabolic in January until the two-day, 16.2% collapse. Its February rally fell well short of reclaiming its previous high, and it has now declined below the February 2nd sell-off low, which indicates that gold is in a correction at the very least. It is possible that gold is entering a bear market and the January highs will last a long time. On the other hand, gold mining stocks did make a new all-time high at the end of February, so despite the fact that that they have declined 30% from those highs, they are technically still in an uptrend. In the context of more than tripling from January 2025 to February 2026, a 30% decline is just a “pullback”.
6. I don’t know why oil prices tend to follow gold prices (with a lag of several months), but they sure seem to. David Ranson of HCWE Research was the first to point this out to me, so a hat tip to him. With the superior performance of “hard” assets like gold, silver, copper, oil, uranium, etc. since the middle of 2024, those that have suggested that this decade will favor hard assets over financial assets (stocks and bonds) are looking pretty good. Real estate is a hard asset that really hasn’t done much this decade. Maybe it will have its turn as well.
7. Financial markets wonder if there is a “Trump put” – or a level where Trump will modify his behavior or policies to support the stock and/or bond markets. Given yesterday’s extension of the attack pause for another ten days, I think the level of 6500 on the S&P 500 was where the Trump put was. Below that, I think Trump feels constrained against acting aggressively. I also would watch 4.5% on the 10-year Treasury bond. Bad things start happening for borrowers above that level, and I’m sure his Treasury Secretary has pointed that out to him.
8. I really believe that Trump saw the conflict with Iran as a boxing match, where America was a heavyweight and Iran was a lightweight and America could just punch Iran into submission. I believe a better analogy is that America is an adult and Iran is a 6 year-old and we just punched it several times in a Wal-Mart. Iran is now seeing how much it can scream and carry on and make life difficult for the other adults, who presumably can impact America’s behavior. Children tend to learn fast where they have leverage and where they don’t, and Iran is the same way. I think there is some awareness now in the Administration that they have a 6-year-old-in-Wal-Mart situation, but they are still desperately trying to get out of this with a big win, and I’m not sure that is possible at this point.
9. The way I’m thinking about portfolios now is shorter duration in bonds with an emphasis on mortgages and structured credit over corporate bonds. I would also be temporarily reducing my international currency exposure (bonds and stocks). I have and would continue to trim emerging market equity exposure outside of Latin America. As far as U.S. stocks go, I would be modestly underweight, especially to financials and consumer durables (retailers) because I think rising energy prices are hitting peoples discretionary spending. I like the energy sector but the big oil majors have had a big run-up so I wouldn’t go there; pipelines might be a better bet.
DISCLOSURE
Past performance is no assurance of future results. Trademark Financial Management, LLC (“Trademark”) is a registered investment adviser with its principal place of business in the State of Minnesota. Trademark and its representatives are in compliance with registration requirements imposed upon investment advisers by those states in which Trademark operates. Trademark may only transact business in those states in which it is registered or qualifies for an exemption or exclusion from registration. This newsletter is limited to the dissemination of general information pertaining to its investment advisory/management services. Any subsequent, direct communication by Trademark with a prospective client shall be conducted by a representative that is either registered or qualifies for an exemption or exclusion from registration in the state where the prospective client resides. A complete list of all recommendations will be provided if requested for the preceding period of not less than one year. It should not be assumed that recommendations made in the future will be profitable or will equal the performance of the securities in this list. Opinions expressed are those of Trademark Financial Management and are subject to change, not guaranteed and should not be considered recommendations to buy or sell any security. For information pertaining to the registration status of Trademark please contact Trademark at (952) 358-3395 or refer to the Investment Adviser Public Disclosure web site (www.adviserinfo.sec.gov). For additional information about Trademark, including fees and services, send for our disclosure statement as set forth on Form ADV from us using the contact information herein or by calling 952-358-3395. Please read the disclosure statement carefully before you invest or send money. Any reference to a chart, graph, formula, or software as a source of analysis used by Trademark Financial Management staff is one of many factors used to make investment decisions for your portfolio. No one graph, chart, formula, or software can in and of itself be used to determine which securities to buy or sell, when to buy or sell them, or assist any person in making decisions as to which securities to buy or sell or when to buy or sell them. Any chart, graph, formula, or software used is limited by the data entered and the created parameters. The data was obtained from third parties deemed by the adviser to be reliable. Nonetheless, the adviser has not verified the results and cannot be assured of their accuracy.