

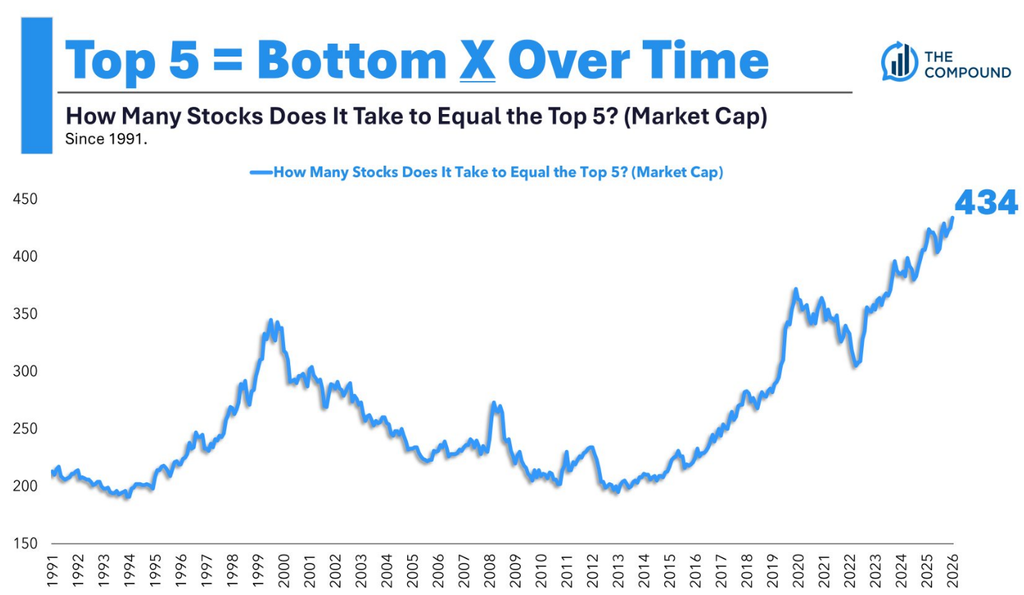
It Takes 434 to Match the Top 5
Source: Michael Batnick (The Compound, data from Bloomberg)
The first chart is another great visual of how concentrated the S&P 500 has grown to be over the years, and in my opinion, this is one of the better ones I have seen that depicts that extreme concentration. NVIDIA, Apple, Microsoft, Amazon, and Google are the top 5 companies in the S&P 500 that equal the bottom 434, which is an extraordinary level of top-heaviness in an index. The index relies heavily on these top 5 names, and even more so on the top 10 names, which make up roughly 40% of the entire index. You may ask how this happened, and well, there are many variables that have led to this heightened concentration, but a few of the key items are:
1) Fundamentally Strong Companies: It would be ignorant to dismiss the business models of these companies, as they have all helped shape the world we live in right now. Most people would struggle to live in a world without 1-day delivery from Amazon or the brand-new iPhone from Apple that you can use to do a Google search. It started with an economic moat that turned into massive revenue numbers and net profits that are unmatched by competitors, ultimately leading these names to the top of the index.
2) The AI Boom’s Concentrated Capital: This is a revolutionary technology due to its speed of adoption worldwide. These are the companies building the chips and the infrastructure for the AI buildout, and where we have seen an unprecedented amount of capital being poured in. The capital distribution has not broadened across the market, yet, it has gone toward the largest names in the United States, which are also the largest companies in the index.
3) Passive Investing Mechanically Enforces It: This is the self-feeding loop that people tend to forget. When money pours into market-capitalization-weighted names, it’s allocated in proportion to size, so the top names get the most money, which makes them larger. If a stock’s price rises, its weight in the index grows, and more passive money naturally flows into it, pushing it up even higher. The S&P 500 is a market-capitalization index with an inherent momentum bias; it rewards the winners and lets the losers fade.
The breadth of the S&P 500 is shrinking dramatically, with ~70% of the names sitting below their 50-day moving average, yet the index is right around its all-time highs, which is greatly due to the top 5 names I mentioned earlier. Diversification across equities is harder to come across, and you will notice that many blended, value, and growth names all share very similar top constituents. There is a reason why active managers underperform the index over the long haul, and if they don’t, then that may be a manager chasing returns to protect its assets while charging a higher fee for positioning itself close to what the index is already doing (closet indexer). Manager due diligence and asset class diversification are as important now as it has ever been in history.
Can Alternatives Replace Bonds?
Source: Macrobond
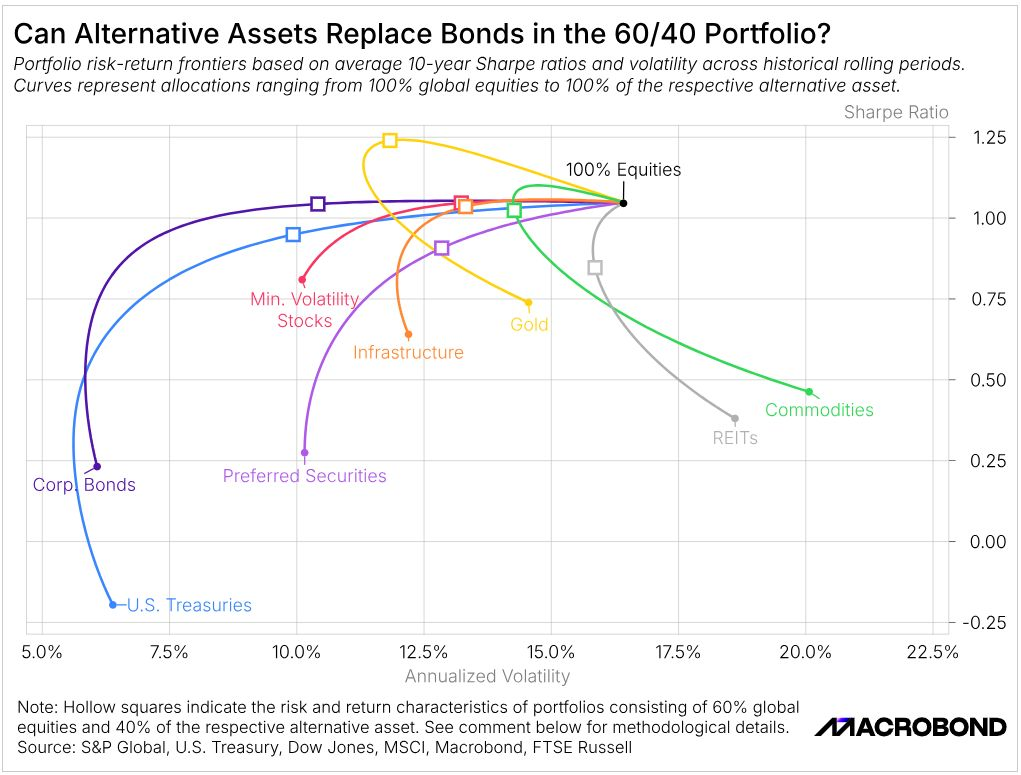
This is a phenomenal chart by Macrobond that tests whether alternatives can replace bonds in a 60/40 portfolio based on annualized volatility and the Sharpe ratio (how much return you earn above the risk-free rate for each unit of volatility you take on). There is a lot to unpack here, so let’s just focus on the individual-colored squares that represent 60% stocks and 40% of the respective alternative asset based on the last 10 years. When the goal is volatility reduction, pairing stocks with bonds comes out on top, which naturally gives a pretty attractive Sharpe Ratio. Gold is a clear outlier for the better, posting the highest risk-adjusted return of any pair on the chart, but realistically, a 40% position is a poor idea. Gold does belong in a portfolio as it acts as an inflationary hedge, has true scarcity value, and can act as a diversifier, but a 40% position in a sterile asset that yields nothing and has brutal stretches of performance (it fell 45% from 2011 to 2015 and stayed depressed after) is not ideal for the majority of investors. All other alternatives show appealing results too, but that 40% should not go to a single asset. It should be filled with asset classes that give you the best opportunity to achieve a desired outcome like diversification, liquidity, absolute return, and others. This chart is also nuanced in that these metrics would look very different in other periods, especially gold, which is important to remember when looking at charts like this. So, alternatives do not replace bonds entirely, but carving out part of that 40% for a mix of alternatives has provided extremely attractive results over the long haul, rather than leaning on just one.
Micron Just Out-Earned Apple
Source: YCharts
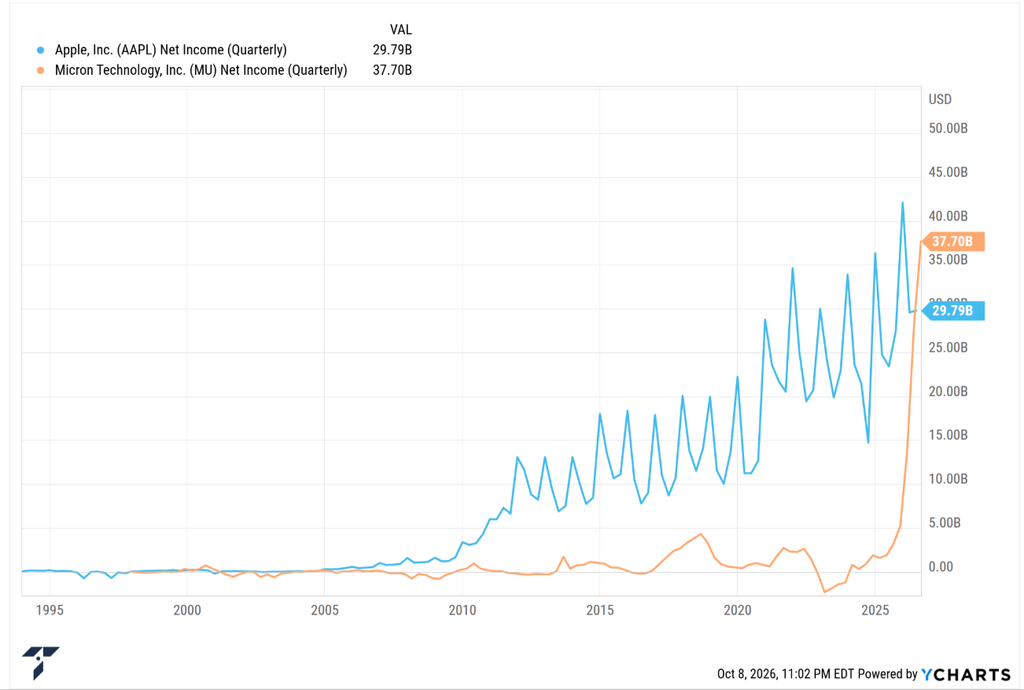
Most people have heard of NVIDIA, but most have not heard of Micron. This is a company that is one of the primary beneficiaries of the AI buildout, designing and manufacturing computer memory and data storage products that are essential for data centers, cloud infrastructure, and large language models. Well, its quarterly net income of $37.70B has now surpassed a steady and world-class profit machine in Apple, climbing from flat-to-negative profit to a vertical spike in a matter of one year. There are plenty of ways to exemplify the AI earnings boom, but to see a company’s profit explode from nothing to surpassing one of the most profitable companies in the world is unequivocally jaw-dropping. We cannot argue the demand these memory companies are experiencing, with multiple-year backlogs of their core products, but we have also seen how cyclical this space has been historically. The critical question is whether this is just part of the cyclical nature of the space and if we are reaching the peak, or whether we are entering a structural shift in how semiconductors, memory, and CPUs/GPUs are viewed in the overall marketplace. There is an argument for both sides, but in my opinion, I don’t think it is one or the other. Instead, I believe we are heading down a path of structural change that will always carry the cyclical DNA. The inevitable consequence of a boom like this is that competition will grow globally, backlogs and demand will not stay this extreme, and the industry giants will not outrun the DNA imprinted in them, but their economics are undergoing a structural shift that may lead to a permanently higher baseline.
DISCLOSURE
Past performance is no assurance of future results. Trademark Financial Management, LLC (“Trademark”) is a registered investment adviser with its principal place of business in the State of Minnesota. Trademark and its representatives are in compliance with registration requirements imposed upon investment advisers by those states in which Trademark operates. Trademark may only transact business in those states in which it is registered or qualifies for an exemption or exclusion from registration. This newsletter is limited to the dissemination of general information pertaining to its investment advisory/management services. Any subsequent, direct communication by Trademark with a prospective client shall be conducted by a representative that is either registered or qualifies for an exemption or exclusion from registration in the state where the prospective client resides. A complete list of all recommendations will be provided if requested for the preceding period of not less than one year. It should not be assumed that recommendations made in the future will be profitable or will equal the performance of the securities in this list. Opinions expressed are those of Trademark Financial Management and are subject to change, not guaranteed and should not be considered recommendations to buy or sell any security. For information pertaining to the registration status of Trademark please contact Trademark at (952) 358-3395 or refer to the Investment Adviser Public Disclosure web site (www.adviserinfo.sec.gov). For additional information about Trademark, including fees and services, send for our disclosure statement as set forth on Form ADV from us using the contact information herein or by calling 952-358-3395. Please read the disclosure statement carefully before you invest or send money. Any reference to a chart, graph, formula, or software as a source of analysis used by Trademark Financial Management staff is one of many factors used to make investment decisions for your portfolio. No one graph, chart, formula, or software can in and of itself be used to determine which securities to buy or sell, when to buy or sell them, or assist any person in making decisions as to which securities to buy or sell or when to buy or sell them. Any chart, graph, formula, or software used is limited by the data entered and the created parameters. The data was obtained from third parties deemed by the adviser to be reliable. Nonetheless, the adviser has not verified the results and cannot be assured of their accuracy.