

Stocks Can Climb the Rate Wall
Source: Denys Liutyi (Macrobond)
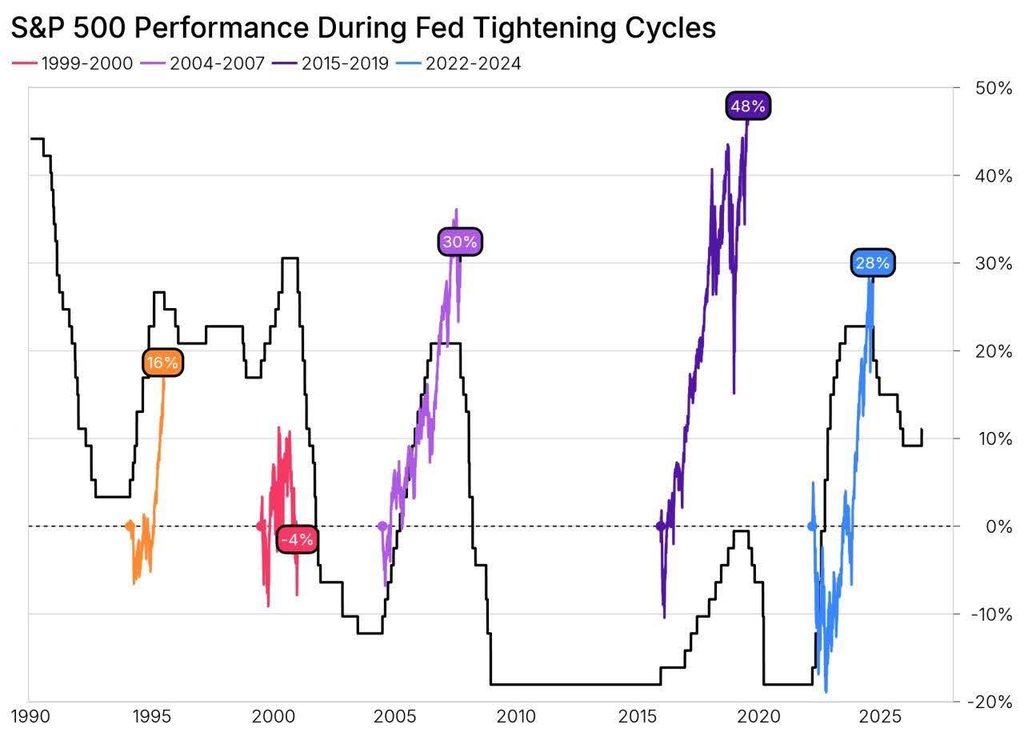
Investors got the rate hike they were looking for on September 16th, with equity markets rallying since the announcement and the 10-year treasury yield hovering above 5.0%. The S&P 500 has traded sideways since early June and needed something to gain another leg, so maybe this is the catalyst that was needed to ease investors’ minds about the Fed falling behind the yield curve. Regardless, all eyes are on future decisions at the end of October and early December, and whether this is the beginning of a rate hike cycle or a one-and-done scenario. The argument against the Fed’s decision to raise rates was that core inflation factors were easing, energy prices were temporary, and higher borrowing costs will continue to affect the average consumer. Bull markets do not go down gradually, they come crashing down, and many believe that a series of hikes will put so much pressure on the consumer that it has the possibility to cause such a crash. The consumer drives the markets, and while this theory sounds good on paper, we have seen strong historical performance dating back to the 1994 cycle. These periods may not be comparable, but it is important to understand that hiking cycles have not killed the market like you may think, instead they’re about cooling an economy that is running hot. There is a world where a Fed tightening and equities rising can coexist, which is exemplified in the chart above where 4/5 rate hiking periods saw average positive returns of ~24.0%. The next cycle will not be similar to the last, but if history offers any reassurance to you, a path of rate hikes does not automatically create a headwind for the equity markets, and I am in the camp of believing this will not be the thorn that pops this bull market.
The Fiscal Force Behind Rising Rates
Source: Bloomberg Economics
Since the 10-year Treasury yield hit highs that we have not seen in 19 years on Wednesday, September 23, I thought it would be appropriate to look beneath that market yield at the natural real rate (r-star) and what has been driving its recent uptick. Before I get into the details, I wanted to give a quick description of nominal rates, real rates, and natural real rates because there is a distinction between the three.
1) Nominal Rate: The interest rate you see quoted on a loan, bond, or savings account that ignores inflation.
2) Real Rate: This is what you’re truly earning or paying with inflation stripped out (nominal rate minus inflation).
3) Natural Real Rate (r-star): The long-run real rate that the economy gravitates to when the economy is stable, employment is healthy, and inflation is under control that acts as a neutral benchmark for monetary policy.
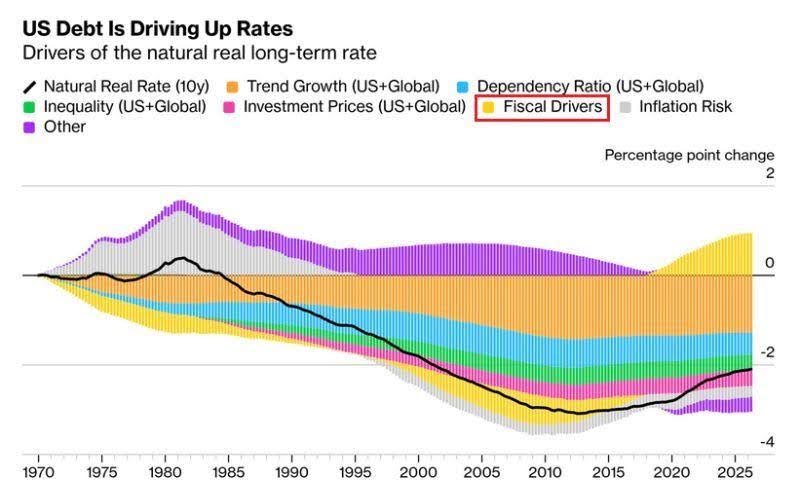
What the graph is showing us is #3, the natural real rate, that is a modeled estimate that helps us understand if policy is restrictive or stimulative. As you can see, for decades the natural real rate was pushed lower by major structural shifts in the global economy, but since 2020 we have seen a reversal driven by fiscal pressures. Massive COVID stimulus that drove widespread spending, continued large deficits (projected at ~6.0% of GDP in 2026), and an unsustainable debt load are now all being reflected in interest rates. If we factor in the U.S. government competing for capital on a global scale with hyperscalers also issuing ~$320B in debt this year, that is just another layer adding to the premium investors demand to then hold its debt. The Congressional Budget Office (CBO) projects that inflation-adjusted real GDP growth will reach ~2.2% in 2026, before stabilizing to ~1.8% over the subsequent decade, while 10-year real yields (TIPS) are currently ~2.77%. CBO projections can change, but the rising real cost of capital outpacing growth is an unsustainable dynamic that is bad for our already poor debt burden and the broader economy, which we have not seen since the GFC. The increase in the natural real rate does not guarantee anything, but it does allow us to understand that we are moving in a more restrictive direction, and that the fiscal pressures may cause rates to stay elevated for a longer period with the hopes that the economy can handle it. The era of low-cost borrowing is likely behind us.
Real Rates Do the Talking
Source: Duality Research
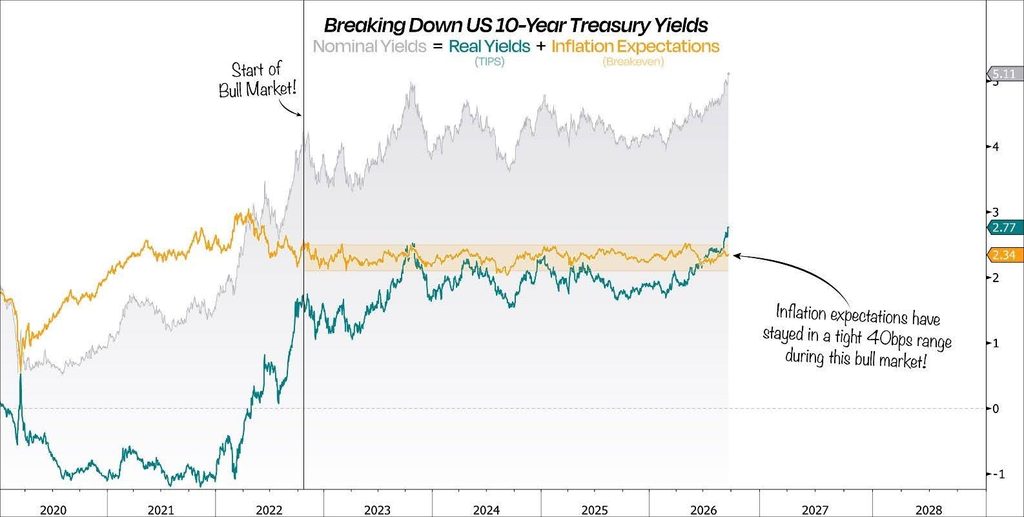
This week’s Trademark Take has a clear pattern and that pattern revolves around interest rates. The reason being is the importance of how they impact our entire economy as when yields rise it affects everything from your mortgage to your credit card balances to any consumer loan you might have. It is a ripple effect between U.S. consumers and businesses that makes borrowing more expensive. The 10-year is sitting at 5.11% per Duality’s time of posting this chart and most people assume it is due to inflationary pressures from the closure of the Strait of Hormuz, but this is not entirely the case. Instead, it is a real yields story, and it has been carrying the upward path in nominal yields for this entire year surging to 2.77%, above inflation expectations at 2.34%. The market seems to trust that inflation won’t get out of hand and has traded range bound for several years now, but the unclear forward fiscal path is directly causing global investors to demand a premium to hold Treasuries. I’ll get into the fiscal pressures on a deeper level in the 3Q26 blog post coming out in October, but I think it would be a disservice not to mention what an attractive setup this is for anyone looking to buy Treasuries right now. Outside of the usual risks of bond investing, yields sit at some of the most appealing levels we have seen in years. If you’re someone looking to park cash in a 1-year Treasury bill, it is currently yielding ~4.50% (the 3-month is ~4.2%), notably above the U.S. money market funds with total assets being around $8T. Who doesn’t like a little extra yield on something that carries relatively low risk? Not many people I would say.
DISCLOSURE
Past performance is no assurance of future results. Trademark Financial Management, LLC (“Trademark”) is a registered investment adviser with its principal place of business in the State of Minnesota. Trademark and its representatives are in compliance with registration requirements imposed upon investment advisers by those states in which Trademark operates. Trademark may only transact business in those states in which it is registered or qualifies for an exemption or exclusion from registration. This newsletter is limited to the dissemination of general information pertaining to its investment advisory/management services. Any subsequent, direct communication by Trademark with a prospective client shall be conducted by a representative that is either registered or qualifies for an exemption or exclusion from registration in the state where the prospective client resides. A complete list of all recommendations will be provided if requested for the preceding period of not less than one year. It should not be assumed that recommendations made in the future will be profitable or will equal the performance of the securities in this list. Opinions expressed are those of Trademark Financial Management and are subject to change, not guaranteed and should not be considered recommendations to buy or sell any security. For information pertaining to the registration status of Trademark please contact Trademark at (952) 358-3395 or refer to the Investment Adviser Public Disclosure web site (www.adviserinfo.sec.gov). For additional information about Trademark, including fees and services, send for our disclosure statement as set forth on Form ADV from us using the contact information herein or by calling 952-358-3395. Please read the disclosure statement carefully before you invest or send money. Any reference to a chart, graph, formula, or software as a source of analysis used by Trademark Financial Management staff is one of many factors used to make investment decisions for your portfolio. No one graph, chart, formula, or software can in and of itself be used to determine which securities to buy or sell, when to buy or sell them, or assist any person in making decisions as to which securities to buy or sell or when to buy or sell them. Any chart, graph, formula, or software used is limited by the data entered and the created parameters. The data was obtained from third parties deemed by the adviser to be reliable. Nonetheless, the adviser has not verified the results and cannot be assured of their accuracy.