

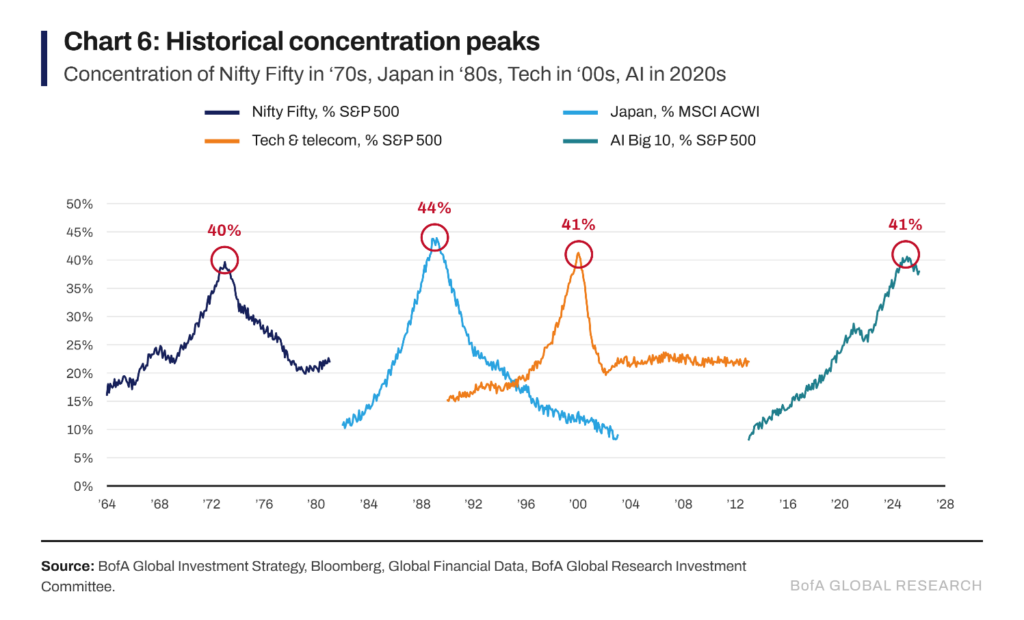
Historical Concentration Peaks
Source: BofA Global Research
The concentration of the main AI players recently peaked at around 41% of the S&P 500, roughly in line with prior concentration extremes that were followed by weaker forward returns. Rather than reading too much into the exact historical comparisons, the level itself is what’s worth sitting with, as 41% is a lot of the market riding on very few names. High concentration doesn’t reliably signal a top, it can persist for years, but it does mean the market’s fate rests heavily on a handful of names, and that’s a risk worth watching. Investors rarely worry about concentration while things move up, but they start to care on the way down. “Stocks take the escalator up and the elevator down” is a Wall Street saying for a reason, which is why prioritizing risk management should always be a foundational piece of investment.
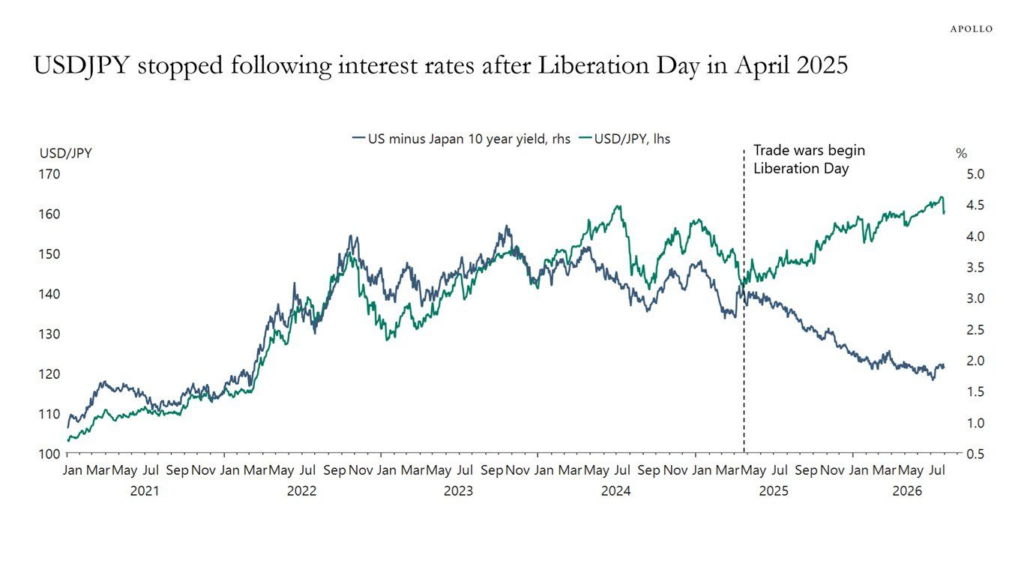
USD-JPY Interest Rates After Liberation Day
Source: Apollo Asset Management
The relationship between the United States and Japan has been driving a lot of headlines lately, especially when it comes to the two countries’ currencies. To put it simply, global investors borrow cheap Japanese yen and use it to buy higher-yielding assets in the United States, a strategy known as a “carry trade,” and that trade is fueled by the yield gap between the two countries (the blue line). What we’ve seen since Liberation Day is a divergence. The USD/JPY exchange rate has trended upward, meaning a weaker yen (green), while the 10-year yield spread has moved lower (blue). In other words, the dollar strengthened against the yen even as the yield advantage that normally drives that move broke down. These two typically move together, so an opposite path for the pair may signal the start of a regime change between the two countries.
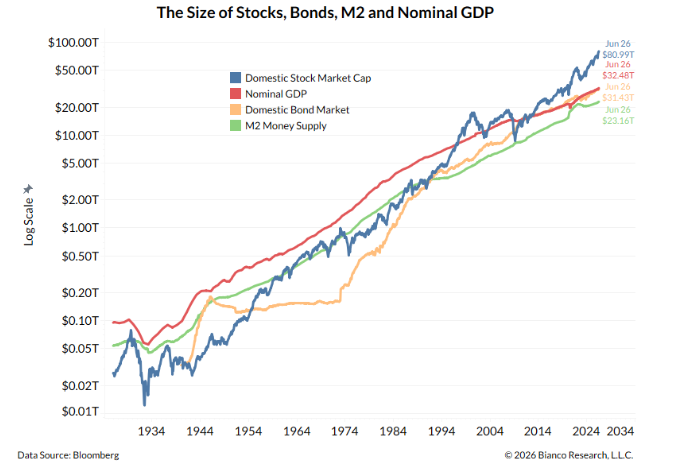
Size of Stocks, Bonds, M2 & Nominal GDP
Source: Bianco Research (data from Bloomberg)
The U.S. stock market sits at roughly $81T, which has truly taken off relative to GDP and the bond market since the financial crisis. The magnitude of that growth reflects countless variables, including a decade of low interest rates, mega-cap tech performance, high levels of foreign inflows, and many more. The green line, M2 money supply, is also a factor that cannot be ignored, as our economy has not only grown organically but has also been fueled by years of monetary expansion, which has inflated asset prices alongside the real economy. As long as the money supply keeps expanding, the incentive to keep reaching into riskier assets like stocks remains strong, especially with the S&P 500 having annualized roughly 15% (total return) over the past 15 years.
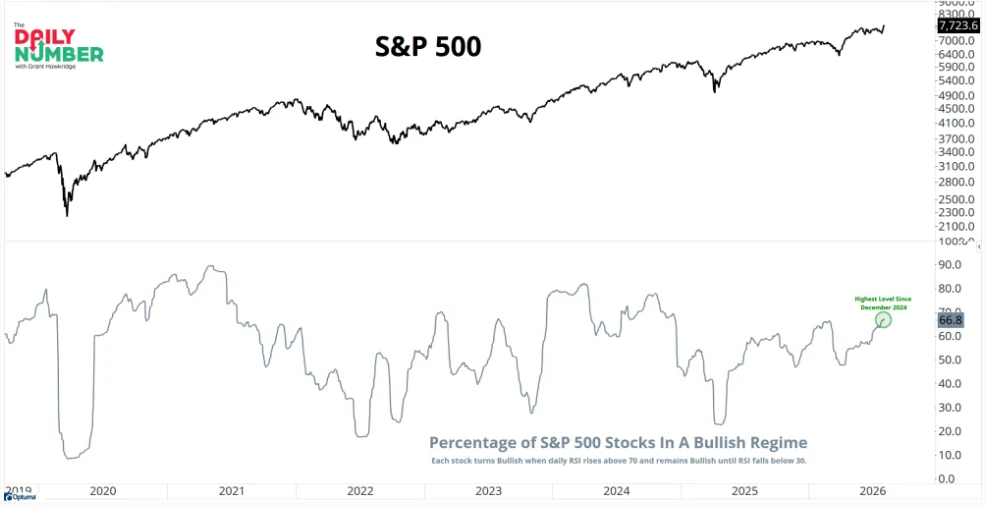
S&P 500
Source: Grant Hawkridge (The Daily Number)
Over the last week, we’ve seen new all-time highs in the S&P 500 as markets continue to digest all the information and earnings reports coming their way. Understanding how the underlying companies are performing relative to the index itself gives investors a better read on market breadth, or how much of the index is actually participating in these highs. Roughly 67% of S&P 500 stocks are experiencing a bullish regime from a relative strength standpoint. In other terms, the index continues to broaden from the March 30 lows, whereas a downtrend in this measure would indicate a less healthy move underneath the surface.
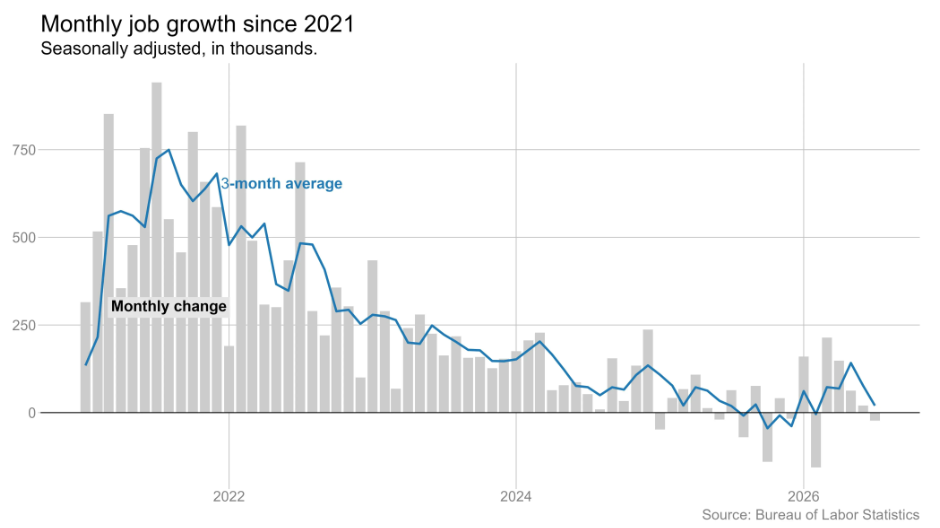
Monthly Job Growth from 2021 Onwards
Source: Ben Casselman (Bureau of Labor Statistics)
Last Friday, August 7, we got the latest jobs report, which undoubtedly left the Federal Reserve in a more difficult position. The U.S. economy lost 23k jobs versus estimates of an 83k gain, and we also saw negative revisions to the prior two months totaling 103k. Adding to the concern, the labor force participation rate fell to 61.4%, its lowest level since February 2021, meaning fewer Americans are working or actively looking for work. The economic landscape and the Fed’s trajectory just became hazier with these prints, and the focus on inflation now looks to be shared more evenly with labor-market concerns. The chart below puts it in context, with the 3-month hiring average continuing to run at some of its weakest levels in years.
DISCLOSURE
Past performance is no assurance of future results. Trademark Financial Management, LLC (“Trademark”) is a registered investment adviser with its principal place of business in the State of Minnesota. Trademark and its representatives are in compliance with registration requirements imposed upon investment advisers by those states in which Trademark operates. Trademark may only transact business in those states in which it is registered or qualifies for an exemption or exclusion from registration. This newsletter is limited to the dissemination of general information pertaining to its investment advisory/management services. Any subsequent, direct communication by Trademark with a prospective client shall be conducted by a representative that is either registered or qualifies for an exemption or exclusion from registration in the state where the prospective client resides. A complete list of all recommendations will be provided if requested for the preceding period of not less than one year. It should not be assumed that recommendations made in the future will be profitable or will equal the performance of the securities in this list. Opinions expressed are those of Trademark Financial Management and are subject to change, not guaranteed and should not be considered recommendations to buy or sell any security. For information pertaining to the registration status of Trademark please contact Trademark at (952) 358-3395 or refer to the Investment Adviser Public Disclosure web site (www.adviserinfo.sec.gov). For additional information about Trademark, including fees and services, send for our disclosure statement as set forth on Form ADV from us using the contact information herein or by calling 952-358-3395. Please read the disclosure statement carefully before you invest or send money. Any reference to a chart, graph, formula, or software as a source of analysis used by Trademark Financial Management staff is one of many factors used to make investment decisions for your portfolio. No one graph, chart, formula, or software can in and of itself be used to determine which securities to buy or sell, when to buy or sell them, or assist any person in making decisions as to which securities to buy or sell or when to buy or sell them. Any chart, graph, formula, or software used is limited by the data entered and the created parameters. The data was obtained from third parties deemed by the adviser to be reliable. Nonetheless, the adviser has not verified the results and cannot be assured of their accuracy.