

Summary
Stocks roared back from a disappointing first quarter with a 14.1% gain in the second quarter. That brought the year-to-date return up to 10.2%. Technology did the heavy lifting – that sector rose 41.4% while the other ten sectors lagged the S&P 500’s gain. In a complete reversal from the first quarter, energy was the worst sector at -9.3%. Building out the artificial intelligence infrastructure was the only theme investors seemed to care about. The industrial and real estate sectors, through the design and buildout of data centers and the cooling, ventilation, and water systems that service them also grabbed some of the strong returns.
International stocks also had a very profitable quarter. Led by Korean and Taiwanese semiconductor stocks, foreign markets rose 14.0%. Developed markets gained 10.9% while emerging markets soared 18.8%. By quarters end, Taiwan Semiconductor, Samsung Electronics, and SK Hynix were the three largest non-U.S. companies in the world by market capitalizations. All three produce semiconductor chips. At number four is Dutch firm ASML, a firm that uses light to “etch” a design on a silicon wafer (photolithography). The takeaway here is that technology has taken over international markets as well as our own. It is getting increasingly hard to diversify portfolios.
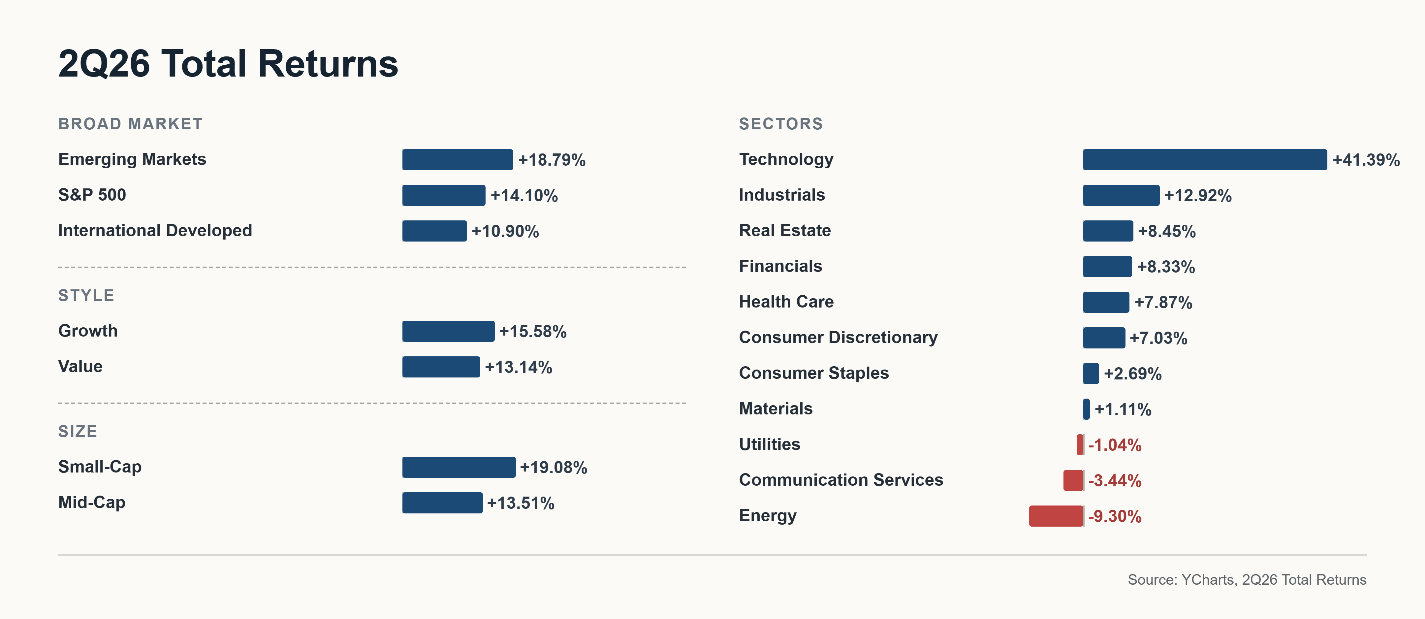
Source: YCharts, Total Returns (4/1/2026 – 6/30/2026)
Bonds rebounded back into positive territory with a 0.7% gain. Once again, the average bond return could not even match T-bills (+0.9%). Certain sectors of the bond market provided decent gains – inflation indexed securities (TIPs), emerging market debt, asset-backed bonds, and municipal bonds each rose more than 1.0%. The big issue for investors is that bonds declined in the first quarter along with stocks, then rose in the second quarter as stocks did, so what good are they in terms of offsetting stock volatility?
If bonds failed to do their “job”, what can be said about alternatives? Gold continued to struggle at -14.0% in the second quarter and silver fared even worse at -21.8%. Precious metals need the threat of long-term inflation to rise, but last quarter the dollar strengthened and the new Federal Reserve Chairman, Kevin Warsh, testified that he was committed to fighting inflation rather than stimulating the economy. On the other hand, commodities tied to the AI buildout such as copper, lithium, and nickel did well and agricultural commodities soared on fears of a “super El Nino”. “Real” assets such as real property, farmland, and timber were modestly higher on the quarter. As geo-political turmoil, tariffs, weather, and “re-shoring” lift commodity prices, we are increasingly adding them to portfolios.
Activity
Technology has performed well – that is no secret. The most surprising part is probably how selective investors have been within that sector. Most of the companies that produce semiconductor chips (Nvidia, AMD, Micron, Broadcom, SK Hynix, etc.) or components (Ciena, KLA, Vicor, etc.) were huge winners. Those that supply software (Microsoft, Adobe, Intuit, Salesforce, Oracle, etc.) got beat down fairly badly). As managers, we had to comb through each fund to see how it was positioned. Here is a chart of semiconductors and software:
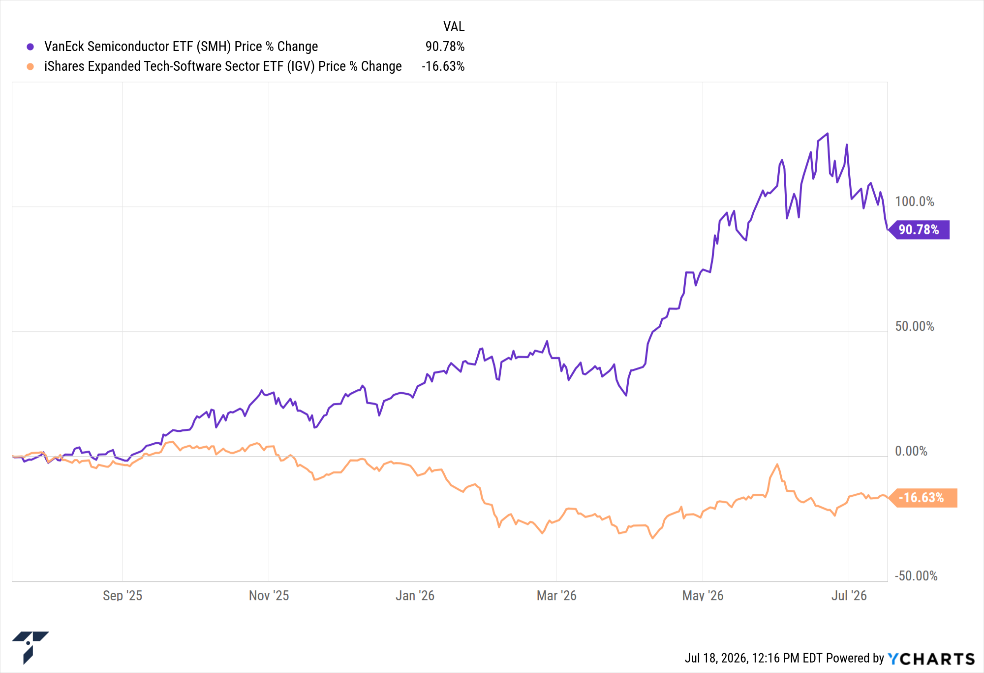
As you can see, a little bit of tilt one way or another made a huge difference. You might argue that semiconductors and software are very different and so their performance should not be similar.
Here is another interesting chart:
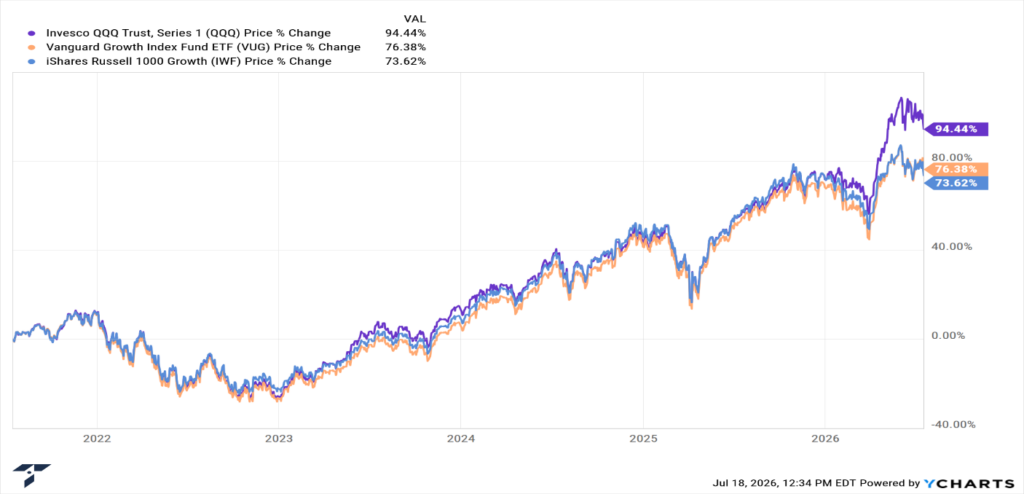
More or less, these ETFs track the SAME large tech stocks. They just have a modestly different method of weighting them. QQQ is a little less concentrated than VUG or IWF. Usually, this doesn’t really matter much. In 2026, however, this minor difference of composition meant QQQ had just a little more Micron Technology, more AMD, more Lam Research, more Sandisk and because those stocks were all up well over 100%, much better performance. All of these ETFs have huge gains in portfolios. In IRAs we could easily sell IWF to buy QQQ, but in a non-qualified portfolio it isn’t practical to realize a 100%+ capital gain (if we bought the fund in 2021 or earlier) to earn a little bit more from those hot semiconductor stocks when you don’t know when the speculative surge is going to end.
Outlook
As stated, last quarter was about the AI trade. Some individual companies in this technology sub-sector doubled, even triple during the QUARTER! When that kind of thing happens, investment managers have to be very careful. There is an old adage that in a bull market stocks go up the stairs and in a bear market they come down the elevator. There is no better illustration of that than gold.
Gold miners tripled in the 14 months through February 27th, 2026, but lost almost 44% over the next three weeks. Today, over half of that huge gain has been given back. The fear, of course, is that this will also happen to tech stocks (just as it did during the dot.com era).
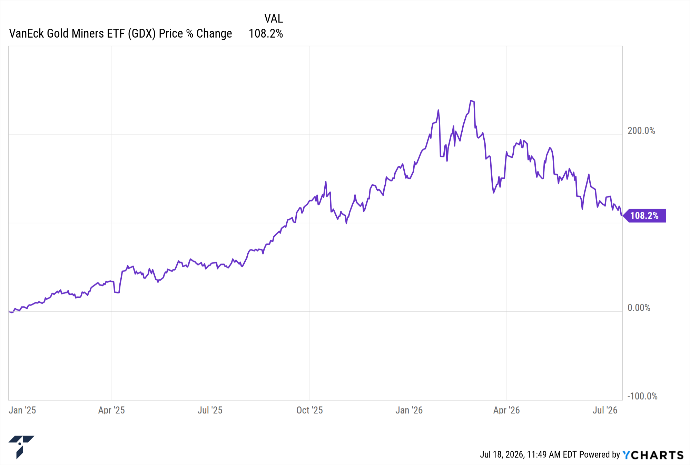
I would estimate that technology, as an investment sector, is about 40-50 times larger than gold. Gold’s decline has been easily absorbed in most portfolios because it was only a fraction of total value. If that kind of plunge happened in technology, the economic implications in terms of lost purchasing power could the seriously affect U.S. economy. This is why we watch it so carefully!
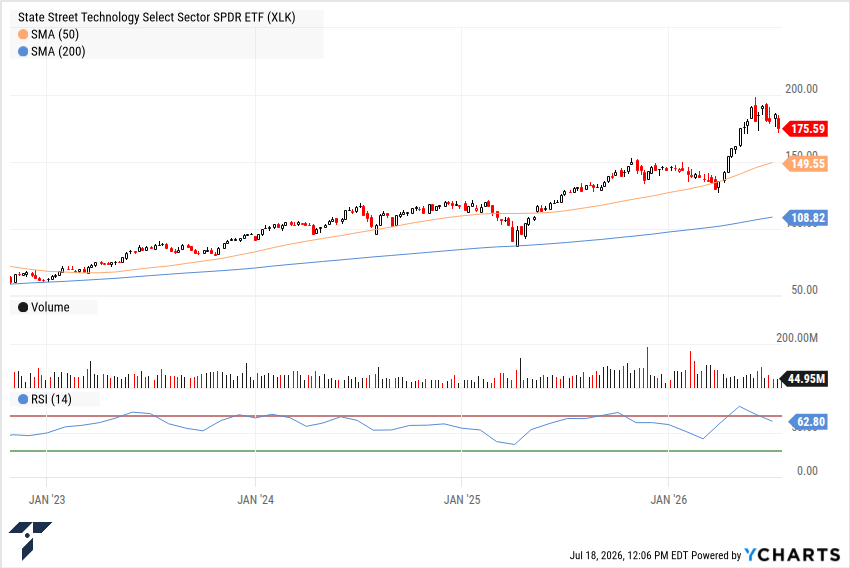
Occasionally, stocks get very far above their moving averages and investors get nervous and they start to take profits. If such a decline gets going, it often requires a successful bounce off of a moving average to restart the uptrend. It is possible that technology will test its 50-day moving average which is 16.0% below current levels. That said, I am skeptical that this will happen in the near term. The most recent test was only four months ago, and sharp declines in July and August are much less common than in later months.
Commentary – Bonds; How Did We Get Here and Where Are We Going?
When I started in the investment business in 1986, bonds were a core component of portfolios. This was both because bonds yielded close to 10% and because stocks were regarded as risky. Today bonds yield less than 5% on average and are fairly despised by investors because stocks have returned several times more than bonds since 2010. I would like to discuss how we got here and what the prospects are for bonds going forward.
During World War II one could purchase bonds from the U.S. Government to help finance the war effort. Series E bonds cost $18.75 and could be redeemed in ten years for $25, providing buyers with a compounded annual return of just over 2.9%. This was less than the rate of inflation of course, as wartime shortages pushed up prices. Most people felt, however, that a modest inflation-adjusted loss was a small price for supporting one’s country. From the early 1940s to the end of the 1960s, investors received an average return of about 4.0% on bonds, but since inflation was fairly low most people consider that fair. After all, one never knew when the next stock-killing Depression would arrive.
The 1970s would turn out to be a devastating decade for bond investors. Soaring oil prices and poor inflation management by a succession of Federal Reserve chairmen led to soaring consumer prices. Since inflation kept rising, nobody wanted to own debt with a long maturity. Imagine buying the 3 ½% 30-year bond in 1962 and in 1979 getting 3.5% interest when new bonds were being issued at 10% yields. Bond yields provided so little inflation protection that well into the 1980s bonds were referred to sarcastically as “certificates of confiscation”. In truth, however, soaring inflation rates in the 1970s set up the best long-term bond buying environment in American history.
From the peak in late 1981, bond yields began a long decline over the next 30 years. Bond investors would average around 10% annually during that period, rivaling (if not exceeding!) stock returns (without the 30%+ “corrections” stocks experienced in 1987, 2001, and 2008). Unfortunately, just as yields above 15% in 1981 were an unsustainable anomaly, so were the 0.7% yields of 2012. Just as in the post-war period, bonds from 2013 through 2020 provided very little yield. Since inflation was low, investors burned by the twin stock bear markets in 2000 and 2008 were willing hold them as “ballast” at least for a few years. By 2017, however, investors began to be drawn back into the surging stock market.
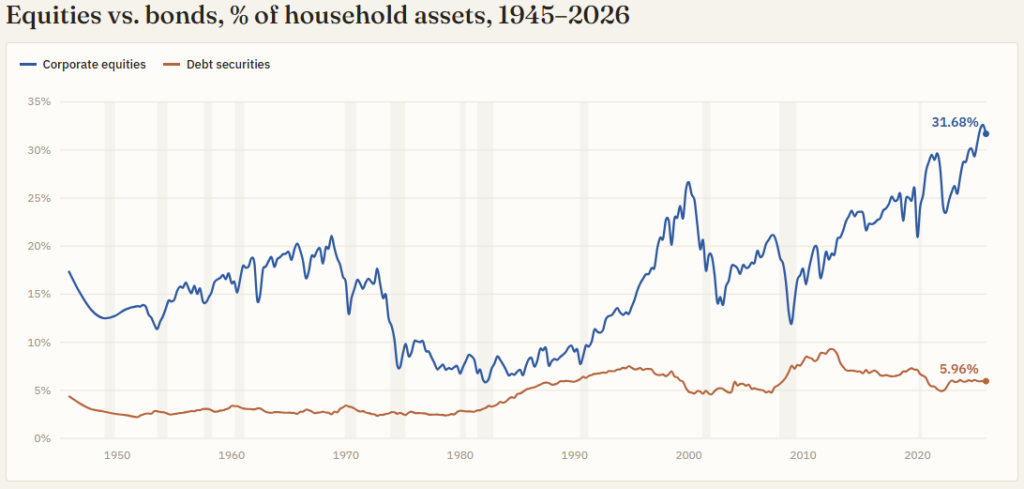
Source: St. Louis Fed (FRED), Equities & Bonds as % of Total Assets, 1945–2026
The 2020s have been about as much of a shock to bond investors as the 1970s were. If financial history is cyclical, then we have entered a period that could be quite unfavorable for bonds. Best case, one could say that COVID year (2020) bond yields were an anomaly and that the interest rate cycle bottomed in 2012. If so, we are close to halfway done with the rising part of the cycle. It is clearly true that investor preference for bonds is at a historical low. The why – a -13% loss in 2022 that hasn’t yet been fully recovered – is understandable. That said, there is no modern precedent for a cycle of rising bond yields not to eventually impact the stock market. It happened during my first full year in the investment business (1987) and as you can see on the chart, it happened prior to downturns in 1994, 2000, 2008, 2018, and 2022. Bull markets love low and falling interest rates and they can tolerate stable or gently rising interest rates if the overall level is modest. Rates above 5% and rising are very hard on stock prices.
Bond Yields, Historically
Bond yields dropped below 1.5% in 2012. That was unsustainable given the efforts to normalize the economic growth rate. In order to bring rates to 4.0%, which is reasonable in an economy with a 2.5%-3.0% average inflation rate, we would have to see either a long period of near-zero bond returns (2013-2018) or a short period of highly negative returns (2021-2022). Because of COVID we got both. At this point, however, bond yields are high enough that the worst is clearly behind us.
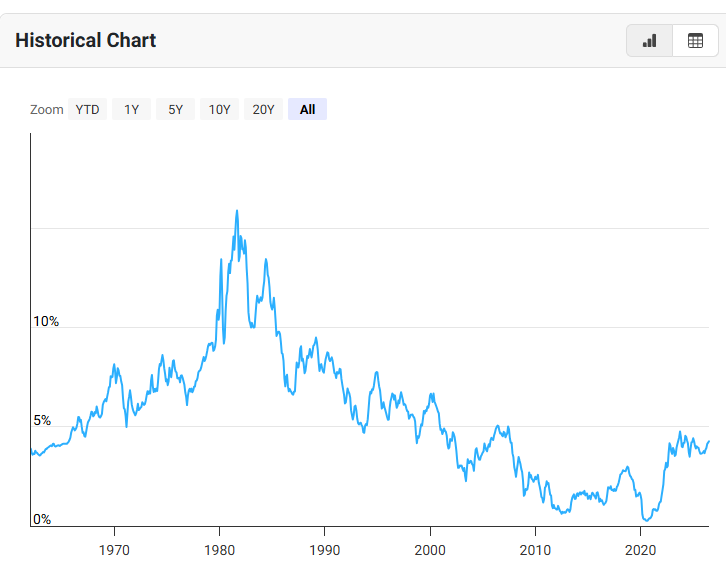
Source: macrotrends (macrotrends.net)
The reason for this commentary is to take you through why bonds are unpopular right now but also to make you aware that while they are not likely to provide double digit returns anytime soon, their point of maximum risk has passed. They cannot possibly be as bad a value today as they were in 2013 or 2021 because 4.0% yields are a much better inflation cushion than 1% yields. Secondarily, I want to reinforce the idea that one cannot logically simultaneously hate bonds and love stocks because times of poor bond returns are usually not very good for stocks either. The current situation – that bonds are not very attractive as either a stock diversifier or a way to build wealth in their own right – has driven a lot of investors to other assets. We might be entering a period that will be somewhat similar to the 1970s in which commodities outperform both bonds and stocks. If so, rising yields will eventually provide the fuel for the next long term bond bull market.
DISCLOSURE
Past performance is no assurance of future results. Trademark Financial Management, LLC (“Trademark”) is a registered investment adviser with its principal place of business in the State of Minnesota. Trademark and its representatives are in compliance with registration requirements imposed upon investment advisers by those states in which Trademark operates. Trademark may only transact business in those states in which it is registered or qualifies for an exemption or exclusion from registration. This newsletter is limited to the dissemination of general information pertaining to its investment advisory/management services. Any subsequent, direct communication by Trademark with a prospective client shall be conducted by a representative that is either registered or qualifies for an exemption or exclusion from registration in the state where the prospective client resides. A complete list of all recommendations will be provided if requested for the preceding period of not less than one year. It should not be assumed that recommendations made in the future will be profitable or will equal the performance of the securities in this list. Opinions expressed are those of Trademark Financial Management and are subject to change, not guaranteed and should not be considered recommendations to buy or sell any security. For information pertaining to the registration status of Trademark please contact Trademark at (952) 358-3395 or refer to the Investment Adviser Public Disclosure web site (www.adviserinfo.sec.gov). For additional information about Trademark, including fees and services, send for our disclosure statement as set forth on Form ADV from us using the contact information herein or by calling 952-358-3395. Please read the disclosure statement carefully before you invest or send money. Any reference to a chart, graph, formula, or software as a source of analysis used by Trademark Financial Management staff is one of many factors used to make investment decisions for your portfolio. No one graph, chart, formula, or software can in and of itself be used to determine which securities to buy or sell, when to buy or sell them, or assist any person in making decisions as to which securities to buy or sell or when to buy or sell them. Any chart, graph, formula, or software used is limited by the data entered and the created parameters. The data was obtained from third parties deemed by the adviser to be reliable. Nonetheless, the adviser has not verified the results and cannot be assured of their accuracy.