

Semiconductors Are Driving S&P 500 Returns in 2026
Source: Warren Pies (3Fourteen Research)
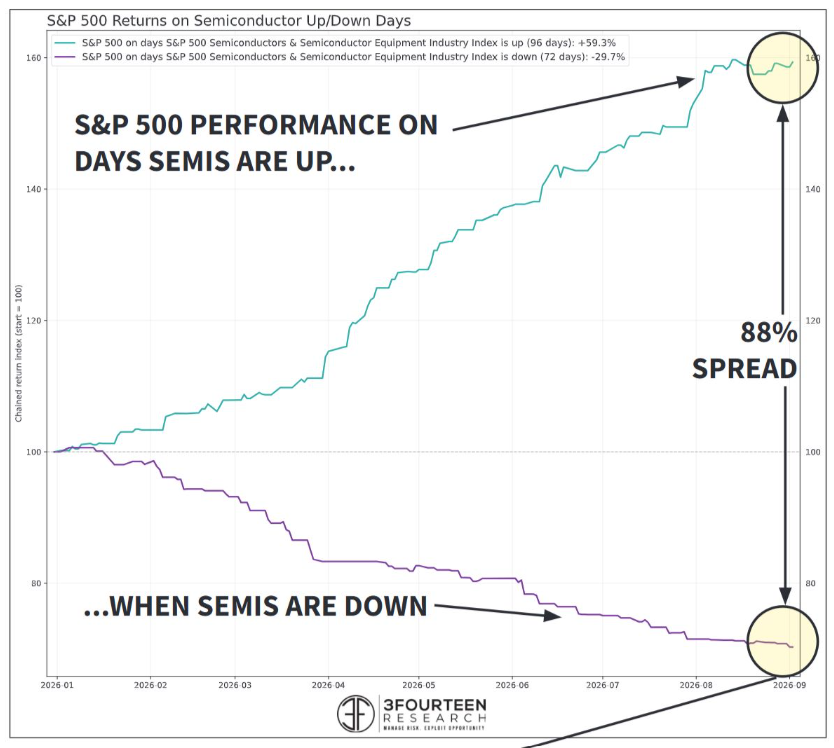
In 2026, we cannot discuss the S&P 500 without mentioning semiconductors and their heavy influence on the index. Semiconductors were once viewed as a pure cyclical play, but now they sit at the center of the AI trade, causing many analysts to reconsider whether they represent a structural shift rather than a cyclical one. Let’s break down the chart above, the green line is the S&P 500’s returns only on days when semiconductors were up (96 days), totaling +59.3%, while the purple line is the S&P 500 only on days when semiconductors were down (72 days), returning -29.7%. As the graphic clearly states, that is an 88% spread in S&P 500 performance based solely on what semiconductors have done this year alone. The industry group is now roughly 20.0% of the index’s market capitalization, meaning it has been a relatively strong proxy for risk appetite among investors this year. In a risk-on environment, the index and semiconductors have been up, and vice versa, marking a year-to-date (as of 9/14/26) correlation of 79.10% between the index and the VanEck Semiconductor ETF. Now, let’s take it a step further by analyzing the coincident drawdown correlation (when both are stressed simultaneously) dating back to the launch of ChatGPT on November 30, 2022. At a 5.0% stress threshold, the pair has an 81.19% coincident drawdown correlation. Meaning, when both experienced a drawdown of at least 5.0% over approximately the past four years, they moved alike. Whether you like it or not, semiconductors have become a primary engine of the market, and who knows how long the influence will last.
U.S Financial Conditions Through the Years
Source: Federal Reserve Bank of Chicago – NFCI (Since 1971)
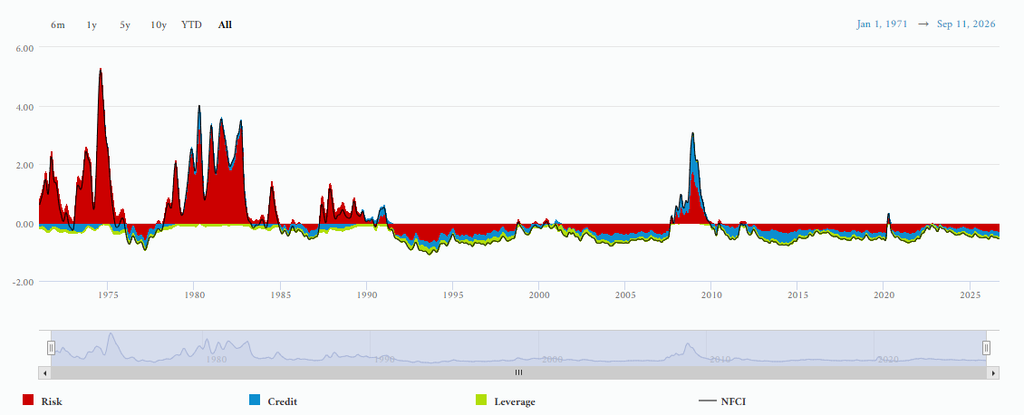
Since there are quite a few question marks surrounding the U.S., I thought it would be wise to take a step back, ignore the noise that never ends, and look at our financial system through the lens of the National Financial Conditions Index (NFCI). This index measures a broad composite of over 100 financial indicators and distills that information into a single number that helps us understand the level of risk, credit, and leverage in our system. For years, we have experienced a more benign and accommodative financial environment, which has supported markets, but let’s not forget the two oil shocks of the 1970s that fueled inflation and forced the Fed to push rates up dramatically (sound familiar?). As the chart shows, measured conditions during that period were as tight as we have ever seen, and we have not seen anything of that caliber besides the Global Financial Crisis. Over the last decade, financial conditions had a brief spike caused by COVID-19, followed by a more prolonged period of tightening during a significant rate-hiking cycle. Since then, conditions have loosened, but the Fed has now hiked rates by 25bps with potentially more on the way this year, directly tightening the cost of borrowing. Another contributor is mounting fiscal pressure, which is pushing up yields on the long end of the curve, while the Fed’s hike tightens the short end, meaning both ends are simultaneously adding to tighter conditions. This doesn’t mean we’ll see an immediate turnaround in conditions, but with the Fed announcing its first-rate hike since 2023, that means this period of looser conditions may come to an end as credit will become harder to obtain and stress starts to weight on the economy.
A Rising Market With a Falling Multiple
Source: Bastien Chenivesse (Bloomberg)
It is important to always analyze equity markets from the seats of a bull and a bear, so let’s paint the picture from both. In past Trademark Takes, I’ve talked about the headwinds of equities including the concentration risk of the S&P 500, the circular financing amongst the top hyperscalers, surging global bond yields, and so on. This is not because I am a bear, but because I am a risk manager first and foremost, and loss aversion is absolutely a thing (loss is twice as intense as the pleasure of an equivalent gain) when it comes to investing.
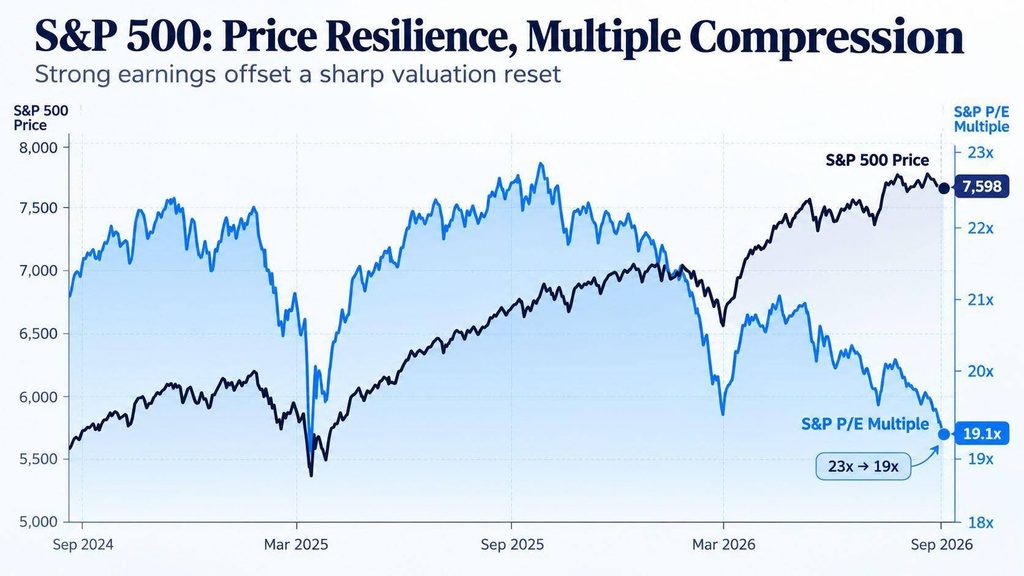
Bull: The bull case is compelling. The S&P 500 continues to show its resiliency through a period of polycrisis while earnings continue to show strength, and its multiple has actually compressed from 22x to 19x, ruling out multiple expansion as a driver. The top EPS earners in the index are contributing to this compression, and most would just focus on that. However, the number of S&P 500 stocks with a forward P/E of more than 40x is now just 27. The last time so few names traded above that level was the 2022 bear market low and the 2020 COVID crash, so underlying stock valuations look a lot more attractive than in other periods. Sometimes the best thing you can do is not be too cute with an analysis. Many of the top names are getting cheaper, and the broad index looks to be following in their footsteps. I’d argue that’s one of the healthiest ways for the market to de-rate, through earnings growth catching up to price, rather than through a panic-driven selloff.
Bear: Regardless of the number of names looking more attractive, the top names are carrying multiple compression and a 19x multiple indicates the valuation cushion is shrinking. The market is heavily leaning on earnings to keep delivering and every quarter investors expect better results and higher forward guidance. If earnings are one wing of the plane, then multiple expansion is the other wing, and I am pretty sure you cannot fly properly with just one wing. The negative sentiment angle is the next piece, a falling P/E doesn’t always mean earnings are outpacing price, it can also mean investors are less optimistic about the future and no longer willing to pay a premium. If earnings are the only thing keeping the market afloat, then that is a lot of weight on one tailwind, especially with climbing rates, fiscal pressures, and ongoing geopolitical tensions all staring you down.
The argument between the two runs in all directions, but both cases rest on the same fact, a market is rising and multiple is falling, and that is what makes this worth watching as we finish off the year. You may believe this is a healthy de-rate or a market relying too hard on earnings or just a combination of many things, but at the end of the day no one truly knows. A disciplined plan and diversified portfolio are the two things you can control when all else is uncertain.
DISCLOSURE
Past performance is no assurance of future results. Trademark Financial Management, LLC (“Trademark”) is a registered investment adviser with its principal place of business in the State of Minnesota. Trademark and its representatives are in compliance with registration requirements imposed upon investment advisers by those states in which Trademark operates. Trademark may only transact business in those states in which it is registered or qualifies for an exemption or exclusion from registration. This newsletter is limited to the dissemination of general information pertaining to its investment advisory/management services. Any subsequent, direct communication by Trademark with a prospective client shall be conducted by a representative that is either registered or qualifies for an exemption or exclusion from registration in the state where the prospective client resides. A complete list of all recommendations will be provided if requested for the preceding period of not less than one year. It should not be assumed that recommendations made in the future will be profitable or will equal the performance of the securities in this list. Opinions expressed are those of Trademark Financial Management and are subject to change, not guaranteed and should not be considered recommendations to buy or sell any security. For information pertaining to the registration status of Trademark please contact Trademark at (952) 358-3395 or refer to the Investment Adviser Public Disclosure web site (www.adviserinfo.sec.gov). For additional information about Trademark, including fees and services, send for our disclosure statement as set forth on Form ADV from us using the contact information herein or by calling 952-358-3395. Please read the disclosure statement carefully before you invest or send money. Any reference to a chart, graph, formula, or software as a source of analysis used by Trademark Financial Management staff is one of many factors used to make investment decisions for your portfolio. No one graph, chart, formula, or software can in and of itself be used to determine which securities to buy or sell, when to buy or sell them, or assist any person in making decisions as to which securities to buy or sell or when to buy or sell them. Any chart, graph, formula, or software used is limited by the data entered and the created parameters. The data was obtained from third parties deemed by the adviser to be reliable. Nonetheless, the adviser has not verified the results and cannot be assured of their accuracy.