

Nvidia’s Next Chapter Without Jensen Huang (For Now)
Source: Trademark Financial Management, Yahoo Finance
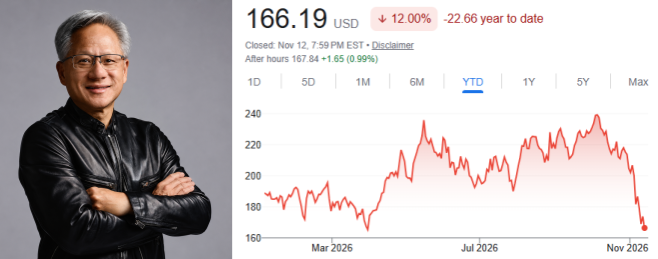
As you may have heard, Jensen Huang has resigned as the CEO of Nvidia after a set of affairs has come to light. The first affair was with an executive of Megaspeed, a Singapore-based cloud customer of Nvidia, with U.S. officials also investigating whether or not she was a Chinese intelligence asset. More recently, there was a second affair (alleged, not confirmed) with a senior executive of a company, which was the nail in the coffin for the CEO as that evening he met with the board and formerly resigned. As expected, the stock price has taken a tumble and one of the most important companies in the world is forced to move forward without the man that pioneered accelerated computing. There is currently a “Stand with Jensen” petition calling for his reinstatement with over 160k signatures across employees, shareholders, and other prominent technology executives. This letter was launched with the goal for the board to bring him back until the investigation is complete, and who knows if this is the right call to make, but I do believe that this all happened very quickly and emotionally for someone of his stature.
Key-person risk needs to be highlighted as Jensen Huang was arguably the second most important CEO to a U.S. company outside of Elon Musk, in my opinion. The business itself has not changed, but major strategic, political, and regulatory scrutiny will be faced for quite some time now and the question will be if the interim CEO and other executives can reassure shareholders and clients that they will not miss a step without him. This resignation is monumental to say the least, and even if Jensen did come back as CEO, the company will possibly face new chip trading regulation constraints that will largely impact its overseas market flow with China and Singapore that make up nearly a 5th of its global billing. Instead of getting caught up with the drama, we need to be forward looking about what is to come for the future of the company that is sitting on the forefront of the entire AI trade, so here are three quick thoughts:
1) The company has an extensive backlog going all the way through 2029. Direct order visibility totaling over $1T for 2027, and other multi-year deals extending beyond that. It will be important to watch how future orders look and if the new team has the same ability to execute.
2) There were dozens of executives that reported straight to Jensen, so organizational risk could be detrimental, and this could lead to key talent heading elsewhere. People feel safe when uncertainty is less, and there has never been this level of uncertainty at Nvidia before.
3) Nvidia can control its products and future executive team, but they cannot do the same with Washington, the courts, and the investigation findings. The longer the overhang, the more likely it will affect future revenues.
The AI Memory Trade Faces Interesting Capital Flows
Source: The Daily Chartbook (Data from Koyfin)
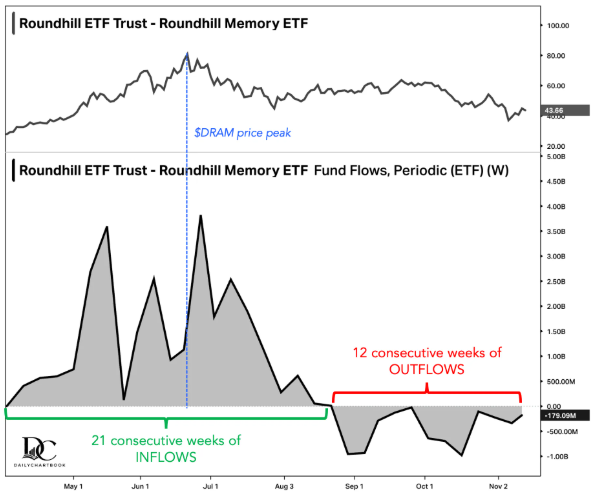
The Roundhill Memory ETF is a fund that focuses on the companies that provide the necessary components for AI through physical hardware and chips, which are essential for powering these large-scale intelligence models that many use on a daily basis. The key manufacturers and main constituents of the ETF are Micron Technology, SK Hynix, Seagate Technology, Sandisk, and more. This chart is a great proxy for the high-beta AI names that have given investors strong returns over the past couple years, and capital inflows for the first 21 weeks hit a high of $4B, which is just one example of the euphoria we have seen so far. The subsequent 12 weeks saw capital outflows as much as $1B, and to me, that is a mix of many cutting loses from those that got in during the middle of the inflow stage, and simple sector rotation to de-risk from the thematic trade itself. Another interpretation, which might be just as important, are the forces that have prevented new money coming in and turning it positive. Here are a few variables that first come to mind for me: tax-loss harvesting opportunities, the AI story has increasingly become more complicated, and capital has made its way to more defensive U.S. equity sectors. However, I believe the psychology behind the investor is the most important part here, so I believe many holders that got in at the $50-$80 level have been sitting on losses, and any singular bounce in the fund has given them a chance to sell, and that pressure selling from rebounds has kept capital flows negative. Until there is a real catalyst to give these companies a reason to go up, it is safe to assume that the price amongst the memory players will trade range bound and fresh buyers will stay sidelined or invest elsewhere.
Home Prices Take a Breather
Source: Redfin Analysis
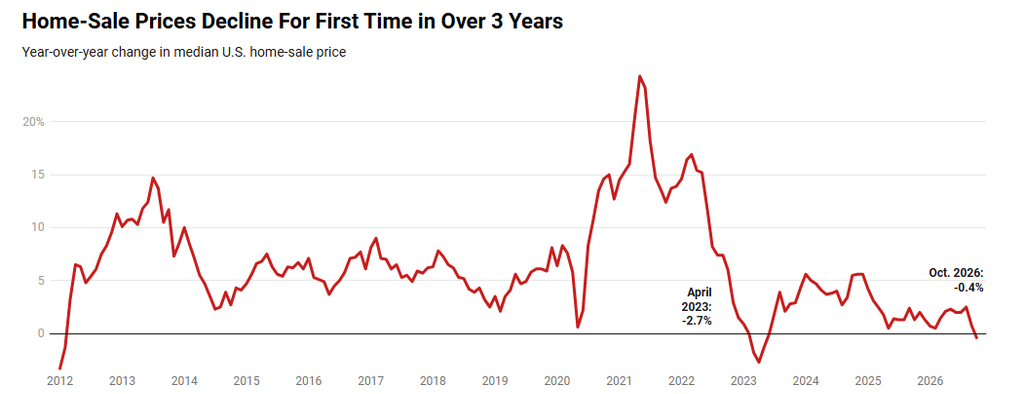
I want to turn my focus to something that has been ice cold for years that many investors and people in general tend to forget and that is real estate. We have seen a mortgage rate “lock-in” effect where homeowners do not want to sell due to extremely low mortgage rates, current mortgage rates hovering around 7.0%, and maybe the most significant being the record-high home prices creating a severe affordability crisis. Let me put it this way, home prices are roughly 55% more expensive than pre pandemic levels, which now puts the median age of a first-time home buyer in the U.S. to 40 years old. That is how a K-shaped market forms, and well, if you are a first-time home buyer or an everyday middle-income individual then browsing through Zillow to find your future home may leave you feeling gloomy. The chart above could give some hope as it shows that the first time since 2023 and 2012 that the year-over-year change in the median U.S. home-sale price has declined by -0.4% in the month of October to $388,634. The softening in price can be influenced by many things, and it seems one of the main drivers behind this decrease is the demand dropoff that pushed the change into negative territory. A combination of pending home sales dropping to its lowest levels since 2021, the number of active buyers holding off until prices become more attractive, and home builders continuing to face disruptions across the real estate ecosystem are all key indicators that point to the lacking demand finally impacting prices. If this frozen market can start to thaw, we will start to see an increase in activity that will create a change from a demand-driven market (inflationary) to a supply-driven (disinflationary), which could be one of the more underrated tailwinds moving into 2027.
DISCLOSURE
Past performance is no assurance of future results. Trademark Financial Management, LLC (“Trademark”) is a registered investment adviser with its principal place of business in the State of Minnesota. Trademark and its representatives are in compliance with registration requirements imposed upon investment advisers by those states in which Trademark operates. Trademark may only transact business in those states in which it is registered or qualifies for an exemption or exclusion from registration. This newsletter is limited to the dissemination of general information pertaining to its investment advisory/management services. Any subsequent, direct communication by Trademark with a prospective client shall be conducted by a representative that is either registered or qualifies for an exemption or exclusion from registration in the state where the prospective client resides. A complete list of all recommendations will be provided if requested for the preceding period of not less than one year. It should not be assumed that recommendations made in the future will be profitable or will equal the performance of the securities in this list. Opinions expressed are those of Trademark Financial Management and are subject to change, not guaranteed and should not be considered recommendations to buy or sell any security. For information pertaining to the registration status of Trademark please contact Trademark at (952) 358-3395 or refer to the Investment Adviser Public Disclosure web site (www.adviserinfo.sec.gov). For additional information about Trademark, including fees and services, send for our disclosure statement as set forth on Form ADV from us using the contact information herein or by calling 952-358-3395. Please read the disclosure statement carefully before you invest or send money. Any reference to a chart, graph, formula, or software as a source of analysis used by Trademark Financial Management staff is one of many factors used to make investment decisions for your portfolio. No one graph, chart, formula, or software can in and of itself be used to determine which securities to buy or sell, when to buy or sell them, or assist any person in making decisions as to which securities to buy or sell or when to buy or sell them. Any chart, graph, formula, or software used is limited by the data entered and the created parameters. The data was obtained from third parties deemed by the adviser to be reliable. Nonetheless, the adviser has not verified the results and cannot be assured of their accuracy.