

Summary
U.S. stocks continued their uptrend in the third quarter, but the gains were largely confined to the technology, energy, health care, and communications sectors. In September, energy and health care joined the other seven sectors in the losses column. In short, the stock market was “ride or die” on technology at quarter’s end, and what that really means is that the market was increasingly placing all its “chips” on artificial intelligence (AI). This is the main reason why the government flatly refuses to do anything to rein AI in. While the large cap S&P 500 was able to grind out a 2.3% gain and push its year-to-date return to 12.7%, small and mid-cap stocks were pounded. August and September and are now (as a whole) trailing large caps for the year. Rising interest rates are hurting companies that cannot grow faster than inflation.
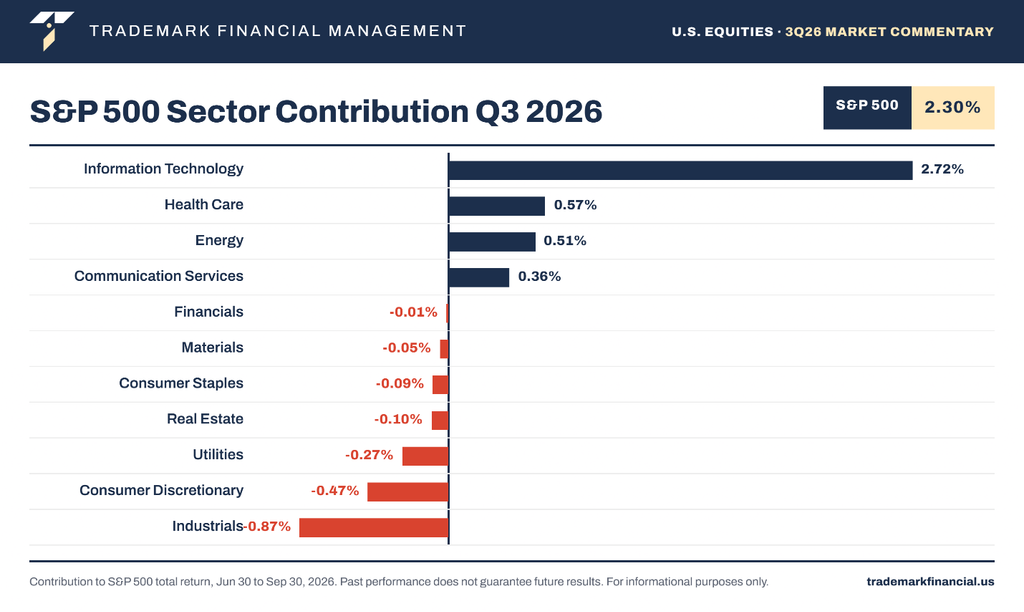
Chart 1: Source: S&P Dow Jones (S&P Global)
Outside of the U.S. stocks were barely positive (0.3%). Japan has a strong quarter on the back of currency intervention and gains in robotics companies. Europe was the laggard in foreign markets due to rising interest rates and political turmoil. South Korea remains the year-to-date leader, despite significant profit-taking among its semiconductor companies in July. Bonds were the worst asset class to be in during the quarter. The S&P Aggregate Bond Index slid more than -3%. Municipal bonds did the worst, dropping almost -6.6%. Not even high yield bonds escaped the downdraft as rising interest rates made bond coupons less valuable. Very short-term bonds and floating rate debt were the best places to hide out – each posted modest gains. Overseas, emerging market debt rose, while developed market bonds had a negative quarter.
The third quarter was another strong month for commodities. Energy, agriculture, and industrial metals all benefitted from greater demand and more challenging shipping logistics. Precious metals gained 2.9%. Many people believe that gold benefits from rising inflation. However, this is only a half-truth. Gold benefits from inflation if interest rates don’t rise enough to protect savers. So far this year, interest rates have soared so much that savers are getting fairly compensated for taking on inflation risk (at least relative to history), hence gold’s mediocre performance. Remember, gold yields nothing.
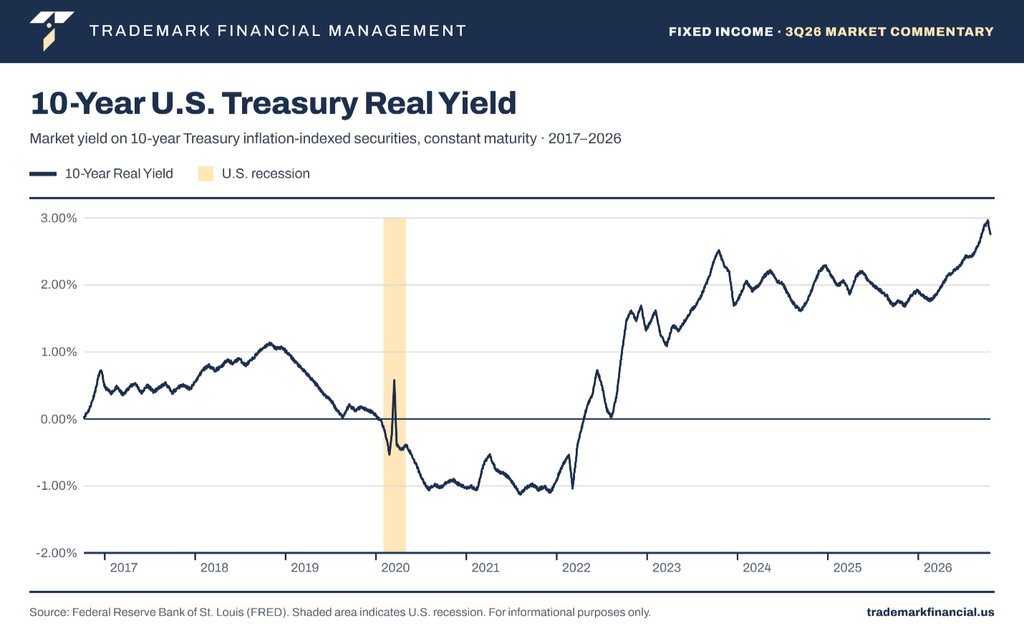
Chart 2: This is the most inflation-adjusted return that bonds have provided in a long time
Activity
On the stock side there wasn’t much activity. The technology love-hate relationship is becoming increasingly volatile (see chart below), such that it is dangerous to try to time. International stocks, smaller stocks, and certain interest rate sensitive sectors got a little less attractive due to dollar strength and higher borrowing costs. We trimmed stock exposure a little bit this quarter to add commodities (more on that in the Commentary section). Bonds required a lot more thought because long duration really punished returns. Best case, one wanted bonds with yields that floated with interest rates and were just as short in duration as T-bills. Exchanging developed market bonds for emerging market debt also paid off handsomely. As suggested by the chart above, we scaled back our gold holdings. The Federal Reserve is no longer pretending that inflation isn’t a problem, so the gold hedge isn’t needed as much.
Outlook
So much depends upon investors’ continued belief that the AI trade will continue to work. History is littered with examples where there was a massive build-out to accommodate new technologies but the actual flow of the promised profits did not show up before the debt came due; railroads in the 1800s, automobiles in the early 20th century, and of course the internet at the turn of this century. It was never that the technology didn’t ultimately deliver. Investors are aware of this, so we oscillate back and forth between the dream of huge profits and the fear that this will ultimately be mostly a mirage.
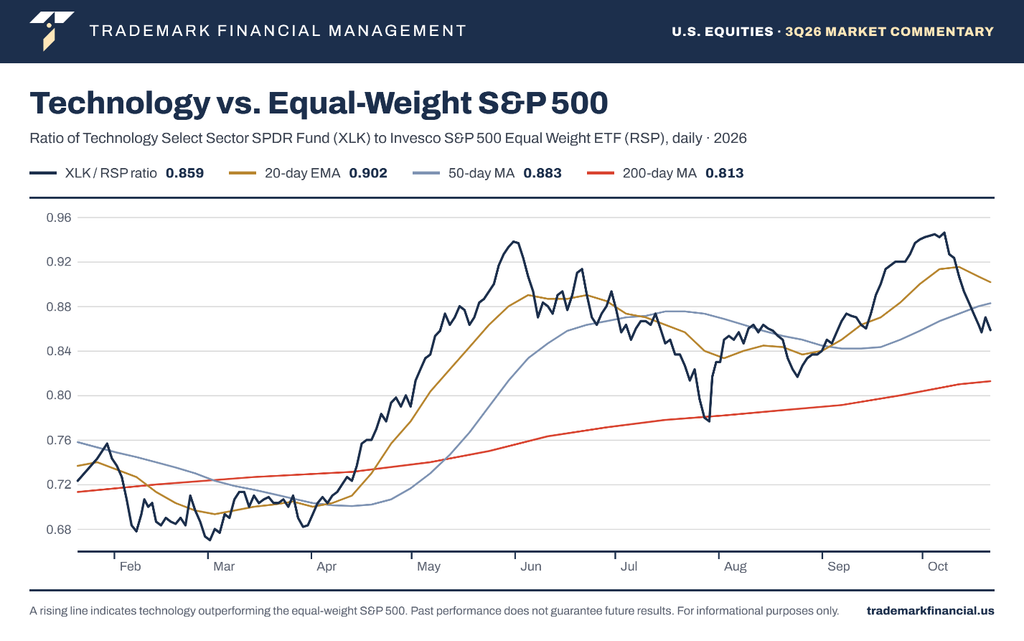
Chart 3: Investors’ love/hate relationship with technology compared to the rest of the market
For our part, we are trying to be neutral here. We are maintaining our diversification, but technology is our largest industry weighting – just as it is for the S&P 500. We would begin to get nervous if any technology sell-off reached levels meaningfully below the previous decline. This bull market has time and time again seen investors come in and buy the dips. If that ever fails to happen, it might be a warning that a 2000-style decline was unfolding.
Commentary – The Opportunity in Commodities
Stock market performance trends are pushing investors deeper into the technology sector, much as they did in 1999. Whether this cycle will also end in a crash isn’t known at this time, but we have to have a plan if things start to move in that direction. What do you do if stocks go into another prolonged bear market, as they did from March 2000 through February 2009? Last quarter I wrote about bonds and how I believed that the worst was over for bonds (though we still haven’t reached a buying point yet). This quarter I want to talk about commodities as another way to diversify from stocks.
Commodities are basic raw materials that can be bought and sold interchangeably because one unit of oil or aluminum or sugar, or wheat, etc. is the same as another. They are usually divided into hard (mined or extracted from the ground) and soft (grown like lumber or raised like cattle). Prices tend to be driven by supply and demand. This is a critical point! As a whole, commodity prices tend to trend, so if one can get on the right side of a trend one may be able to profit for a long time. Hard commodities tend to be used for industrial purposes, so a strong economy pushed demand and therefore prices upward, but the reverse is true in a weak economy. Soft commodities tend to be used for consumer consumption. Prices here are often driven not by demand but by supply – droughts or floods or disease affect agricultural commodities the most.
The biggest weakness that commodities have is that when prices rise, producers can choose to mine or drill or grow more. This brings the price back down. All things being equal, therefore, commodities don’t make great investments over the long term. The exception to that statement is that all things are often not equal. Take oil for example. A spike in oil prices can’t necessarily be fixed by turning a spigot. Transportation can be costly. New fields take time to develop. Supplier relationships can be altered by geopolitics. Opportunities are created when commodities markets do not function the way they are theoretically supposed to for one reason or another.
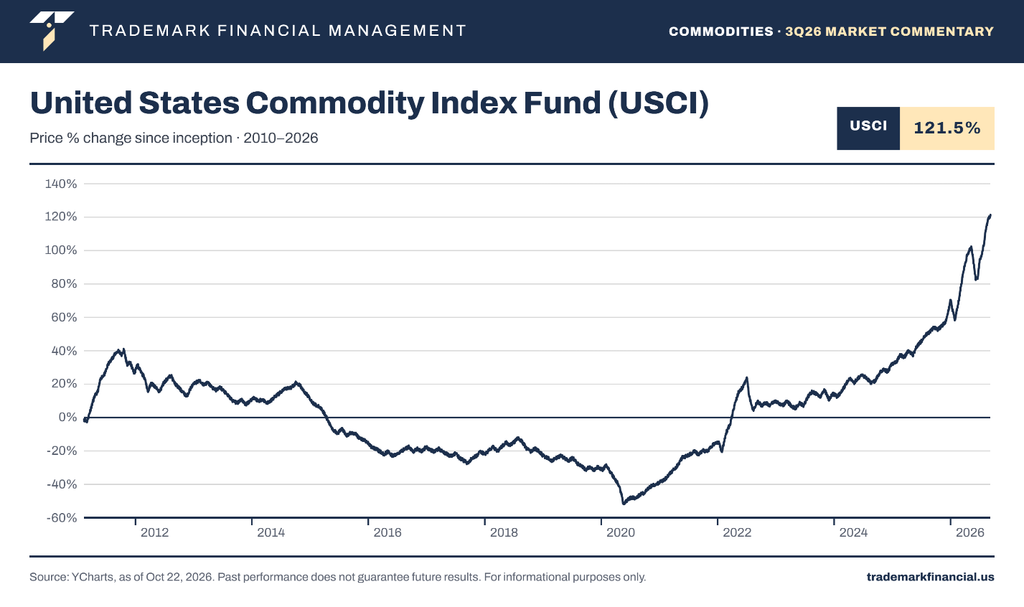
Chart 4: YCharts, as of OCt 22, 2026. United States Commodity Index Fund (USCI)
As you can see, commodities were a horrible investment for almost ten straight years. Why?
1. Supply of most commodities exceeded demand because the global economy was under-consuming in the wake of the Great Financial Crisis;
2. Global trade was largely free from tariffs or restrictions, so it was easy to source whatever you needed.
So what has changed that has made commodities a much better investment since 2020?
1. The global economy is growing faster, and demand for certain mined commodities (rare earth metals) has gone through the roof as emerging technologies continue to need more and more of them.
2. The free trade era would appear to be over. Countries are deciding they need their own stockpiles of natural resources because they can’t count on being able to get them from abroad at reasonable terms (without high tariffs).
3. War in Ukraine and the Middle East has driven up the costs of certain commodities.
4. Other commodities have been negatively affected by environmental/disease concerns as the climate changes (cocoa and orange juice for example).
Because of their inherent volatility, commodities are never going to be a large part of portfolios. Sometimes the correct exposure in this area is 0%. That said, as long as the world as a whole continues to operate in a confrontational paradigm, there will probably be exploitable opportunities in commodities markets. An unusual number of positive catalysts exist today and as long as they persist, we are going to participate.
DISCLOSURE
Past performance is no assurance of future results. Trademark Financial Management, LLC (“Trademark”) is a registered investment adviser with its principal place of business in the State of Minnesota. Trademark and its representatives are in compliance with registration requirements imposed upon investment advisers by those states in which Trademark operates. Trademark may only transact business in those states in which it is registered or qualifies for an exemption or exclusion from registration. This newsletter is limited to the dissemination of general information pertaining to its investment advisory/management services. Any subsequent, direct communication by Trademark with a prospective client shall be conducted by a representative that is either registered or qualifies for an exemption or exclusion from registration in the state where the prospective client resides. A complete list of all recommendations will be provided if requested for the preceding period of not less than one year. It should not be assumed that recommendations made in the future will be profitable or will equal the performance of the securities in this list. Opinions expressed are those of Trademark Financial Management and are subject to change, not guaranteed and should not be considered recommendations to buy or sell any security. For information pertaining to the registration status of Trademark please contact Trademark at (952) 358-3395 or refer to the Investment Adviser Public Disclosure web site (www.adviserinfo.sec.gov). For additional information about Trademark, including fees and services, send for our disclosure statement as set forth on Form ADV from us using the contact information herein or by calling 952-358-3395. Please read the disclosure statement carefully before you invest or send money. Any reference to a chart, graph, formula, or software as a source of analysis used by Trademark Financial Management staff is one of many factors used to make investment decisions for your portfolio. No one graph, chart, formula, or software can in and of itself be used to determine which securities to buy or sell, when to buy or sell them, or assist any person in making decisions as to which securities to buy or sell or when to buy or sell them. Any chart, graph, formula, or software used is limited by the data entered and the created parameters. Information and data contained herein have been obtained from sources believed to be reliable. While reasonable efforts have been made to ensure the accuracy of this information, Trademark Financial Management cannot guarantee its completeness or accuracy.