

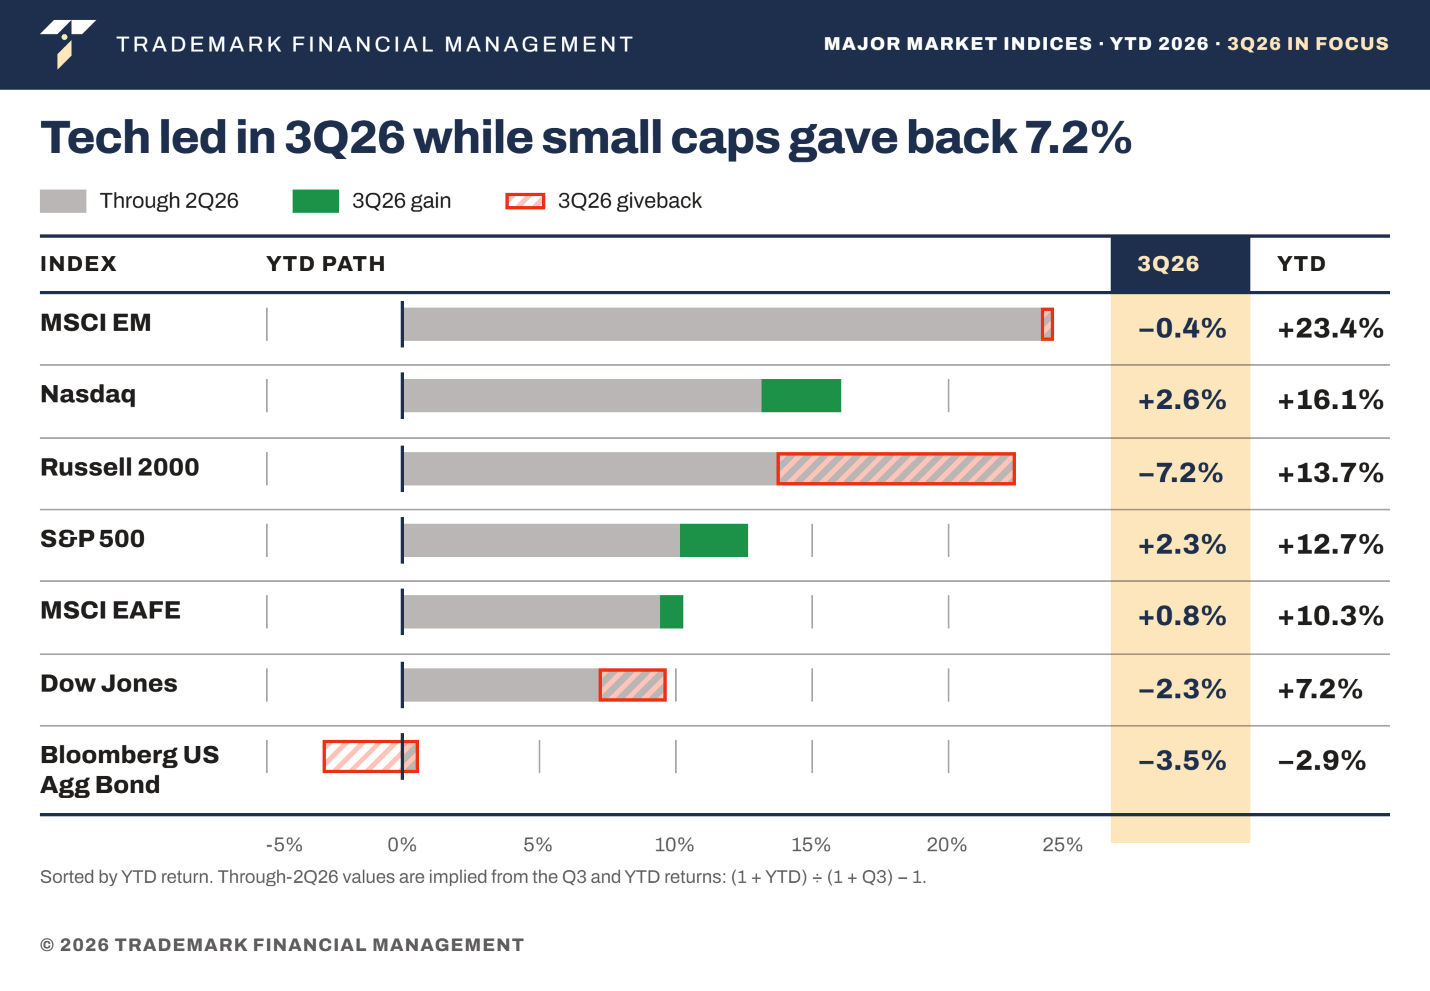
This past quarter was full of stories that left many investors questioning what the rest of the year and moving into 2027 would look like, and well, I do not blame them. This year has felt different from past years, though that may simply be because we’re living through it. Still, if you had told me at the start of the year that the S&P 500 would be up 12.7% on a total return basis through the third quarter despite several significant headwinds, I wouldn’t have believed you. There is a reason why being a short manager (professional that profits from a decline in price of securities) is one of the most difficult professions in this industry because your thesis may look good on paper, but the market may have other plans that are very humbling. Regardless, the top storylines of the quarter I will discuss today have not disappeared from us in the final quarter, the phrase “you can’t get rid of me that easily” is quite suiting in my eyes. Let’s start off the quarterly review by discussing what performance looked like through major market indices.
Source: Morningstar Direct (Data as of 9/30/2026)
1) The Nasdaq and S&P 500 were the only major U.S. indices with positive 3Q26 performance. As we talked about in the October 13th Trademark Take, the breadth in the S&P 500 has diminished throughout the quarter with a handful of mega-cap names driving the performance upward.
2) The Russell 2000 gave back a big chunk of early year gains with -7.2% performance for the quarter, which is largely being driven by the rising rates that impact smaller companies the hardest.
3) The bond selloff was the main headline of the third quarter, with the Bloomberg U.S. Aggregate Bond Index falling 3.5% and erasing its small first-half gain. On the bright side, we believe this could mark a turning point for an asset class that has recently experienced a multi-year drawdown and negative real returns on a rolling 10-year basis.
Source: JPMorgan Asset Management
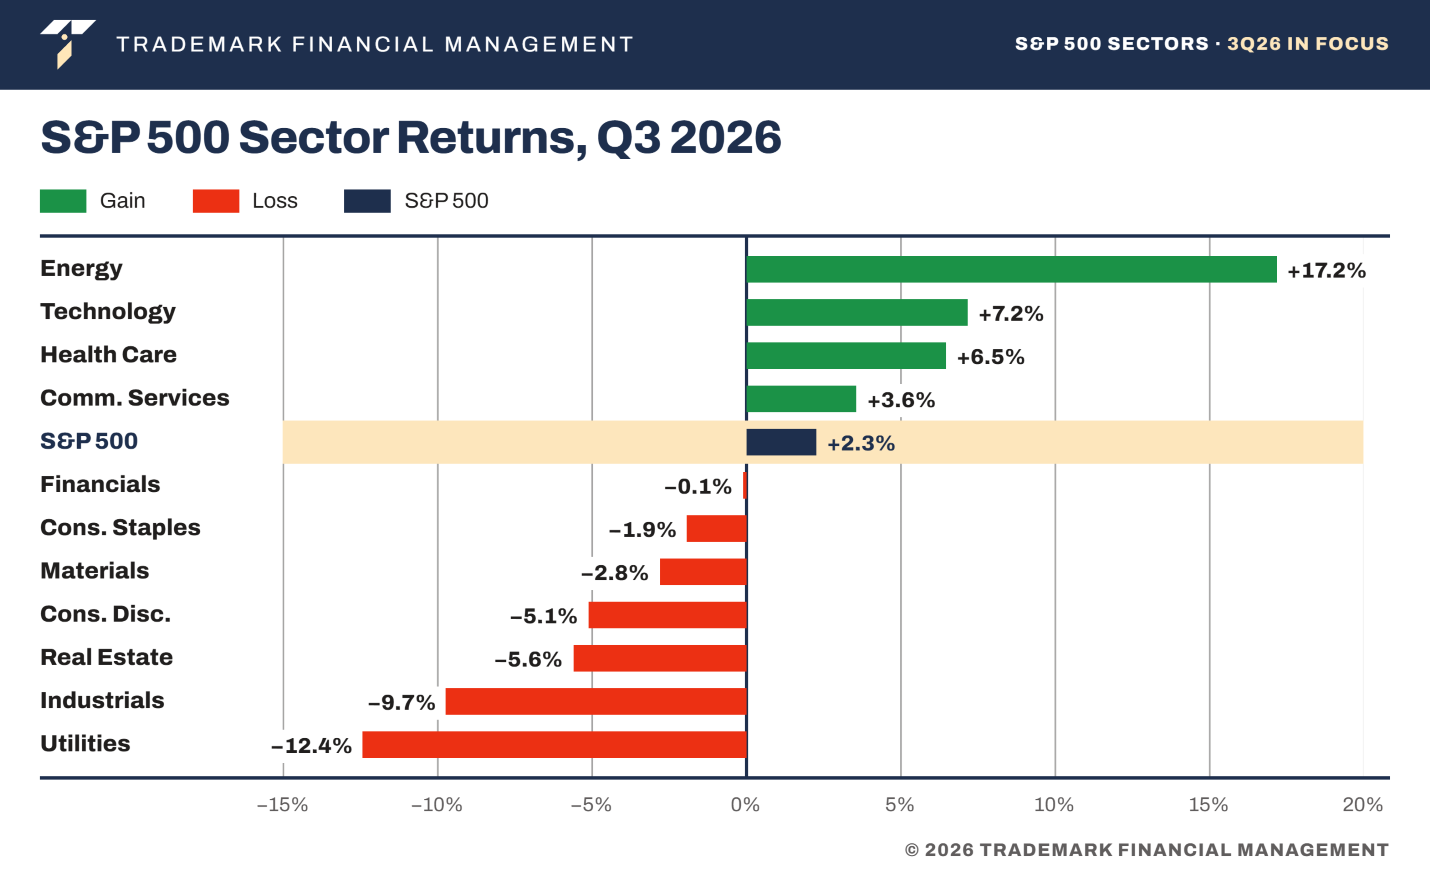
1) There is still no resolution to the U.S.-Iran war, so energy prices including oil and fuel continue to increase around the world. Therefore, energy was the clear winner, rising 17.2% for the quarter, but with the sector being less than 4.0% of the S&P 500, its overall impact on the index was marginal.
2) Interest rate sensitive sectors struggled the most with the 10-year Treasury yield climbing to roughly 5.3% by quarter end. Utilities (-12.4%) and real estate (-5.6%) are often viewed as “bond proxies” as both sectors are capital intensive and rely heavily on borrowing, which makes them extremely vulnerable to high-rate environments.
3) Technology is about 40% of the S&P 500, so its 7.2% return added roughly 2.9% to the index, more than energy that saw an index contribution of about 0.7%. It is important to remember that certain sectors influence the index more than others and that you should view it as a barometer of the stock market, but not the stock market itself.
The 3Q26 Bond Market Tantrum
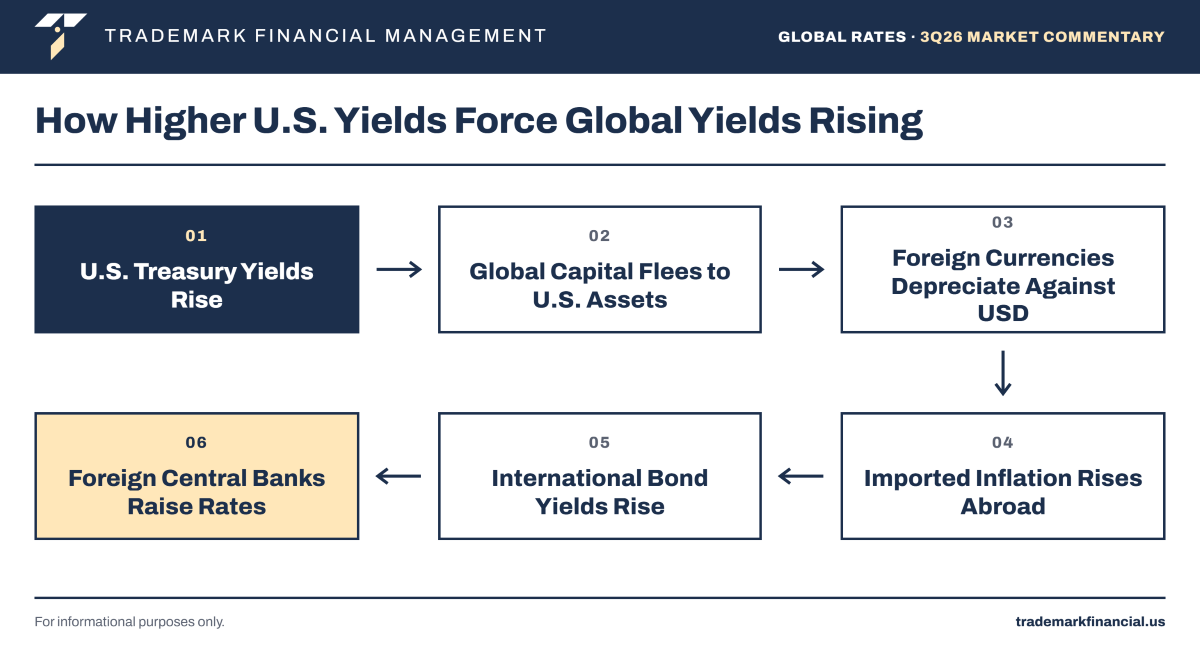
Most people tend to just watch the stock market, but in this quarter, it played the role as the undercard event because the main event occurred in the bond market. Bond market activity typically gains attraction when there is a selloff and in this past quarter that is what we experienced on a global scale. It was driven by a sharp rise in yields across the curve driven by sticky inflation, fiscal deficit worries, and heavy corporate borrowing to fund the AI buildout. It is important to note that this was not just a U.S. predicament but a global repricing, caused by the energy shock and amplified by how interconnected global bond markets are. Many countries are facing their own inflationary pressures from higher energy prices, and several have raised rates in response, but with Treasuries serving as a benchmark for borrowing around the world, rising U.S. yields created a more a broad and synchronized global bond selloff. Below is an illustration of how it has contributed to the underlying strain on economies.
Source: Trademark Financial Management Research
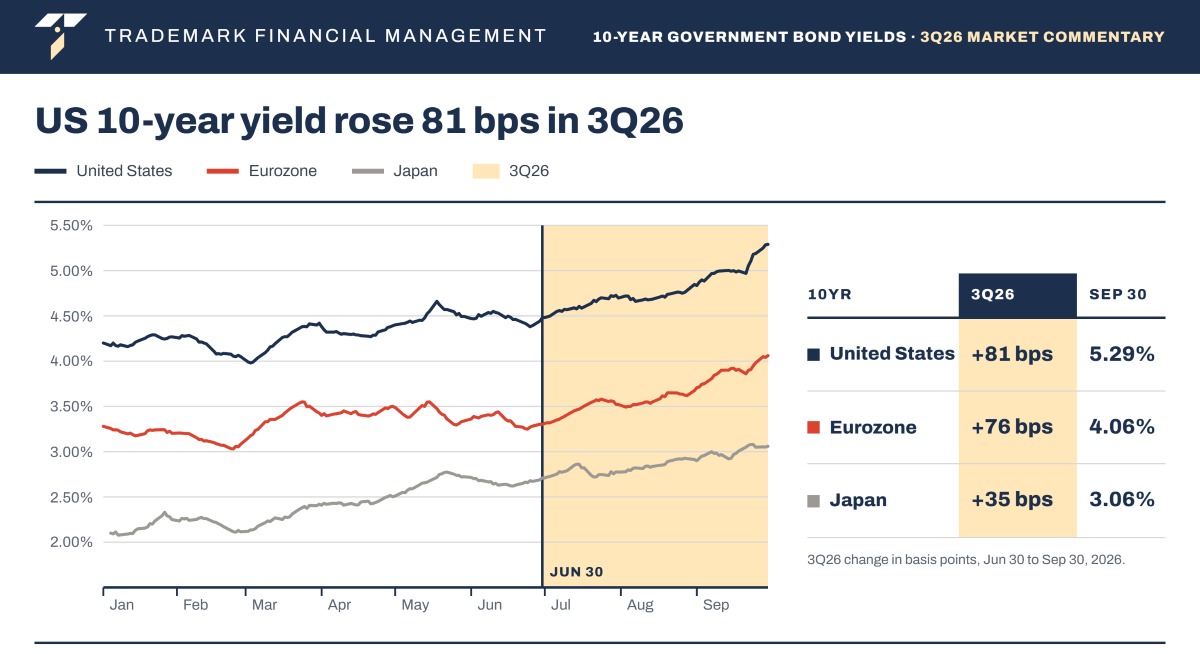
Let’s talk about the two legs that lead to this selloff. The first was the sharp re-escalation in the Middle East that drove oil prices back toward $100 a barrel which caused global inflation fears once again. You may ask why we didn’t see a selloff in the equity market like we did in March, and that is because markets frequently only react dramatically to news once. Now, the reignited fears amongst investors paired with inflation running hot enticed “bond vigilantes” to wake up from hibernation and push yields up, basically telling the Fed that they are behind the yield curve and you need to raise rates. Well, it worked, because the Fed pivoted course and raised rates by 25 bps for the first time since 2023. No war resolution, energy prices soar, inflation creeps up, investors force the Fed’s hand, and then a rate hike. This was one half of the story with several parts, but from there is when we saw a more chaotic uptick in yields that was driven by the supply-and-demand nature of the bond market that gets more technical.
After the initial spike from the Iran conflict there were then more compounding forces that included fiscal uncertainty, an increase in supply to absorb, and a surging term premium. These can be viewed as a structural issue within the U.S. that has been building up for years now, and sometimes a contemplating set of issues just needs a reason to come out of its shell and join the party. The U.S. reached $40T in national debt, driven by a $2T federal deficit, with estimates showing no sign of slowing down moving into the 2030’s. That is a big number, but more importantly, the debt-to-GDP is roughly 125%, meaning we owe more than we produce in a single year. The government is now also competing for capital with the hyperscalers that possess financial strength and high issuer quality with attractive yields over treasuries mainly on the long end of the curve. We are seeing enough interested capital flow to both treasuries and corporate bonds, but we have to ask ourselves, how much longer can this persist before we have a supply absorption issue. There were other events of importance this quarter including an operation twist by Scott Bessent with the goal of lower yields on the long end, declining interest from buyers at Treasury auctions, and institutional selling of bonds adding to the gathered momentum. From there you get investors to be more fearful about the government’s trajectory and so they demand the highest term premium we have seen since the Global Financial Crisis.
Source: YCharts (Data as of 9/30/2026)
However, there were pockets of the bond market where you were able to face lesser losses, which is exactly where a diversified portfolio can produce more attractive results when the broad asset class is struggling. Some places of relative outperformance were found in short duration, floating rate, securitized products, and miscellaneous bond funds. People love to argue the active versus the passive management of equities, but on the fixed income side active management has a much stronger track record than equities. The bond market consists of millions of distinct individual securities vs. a single stock ticker in equities, which allows active managers to exploit certain dislocations in the marketplace and add alpha over the long haul.
The War Comes Back
After months of U.S.-Iran resolution speculation with a ceasefire framework on the table, we ended up getting the exact opposite. The war has been a back-and-forth matter attacking military targets on our end and commercial ships near the Strait of Hormuz on Iran’s end. As expected, oil prices reacted quickly and peaked around $100, but the effects have reached beyond just the oil market as diesel prices hit all-time highs peaking at a national average of $6.53 in September. Energy prices are the main reason for sticky inflation, which led to the Fed’s rate hike, but what is important is not what has happened, but what will happen. What comes next is a mystery to us all, but with Midterms approaching, the likelihood that Iran lets the administration feel the pressure is higher than an imminent solution. Markets are pricing in a longer than expected conflict and disruptions likely to be seen going into 2027 even with temporary emergency reserves looking very thin.
What does this mean for your portfolio? For every headwind, there is an area of the market that may be suitable for a position to assist in risk reduction. In this case, commodities have done an excellent this year in offsetting periods of falling stocks and the recently discussed bond selloff. It started with energy prices surging, but other commodities like agricultural can be viewed as a cousin as prices trailed in its footsteps. The first war shock affected stock prices, the war coming back in the third quarter affected the bond market, but that is why we preach the importance of low-correlating assets that can provide crisis alpha during times of systematic stress. Managed futures, multi-asset class, diversifying strategies, merger arbitrage, equity market neutral; just to give you a few examples of alternatives that not only held up well but saw positive returns. Alternatives do not uniformly perform well during systematic risk events, but certain strategies are designed to act as absolute return performers that can profit when stocks and bonds fall simultaneously, which is why we believe in having an alternative asset allocation.
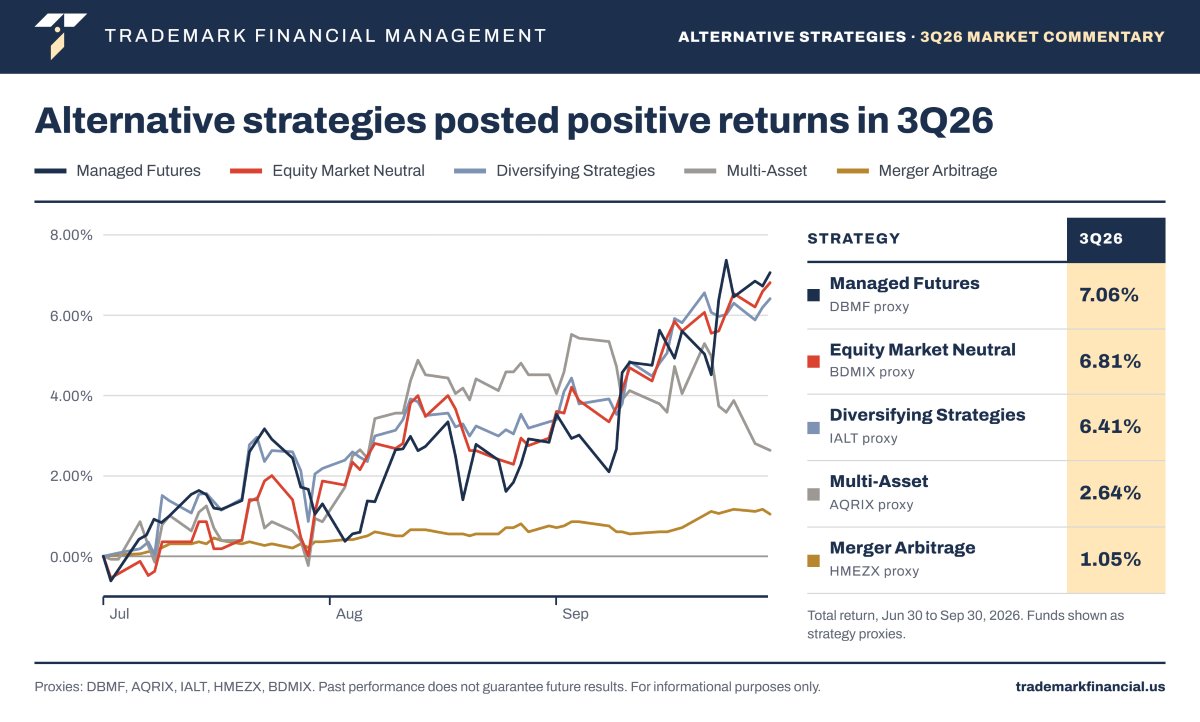
Source: YCharts (Data as of 9/30/2026)
What We’re Watching in 4Q26
1. The Fed’s Next Move
The Fed meets two more times this year. The projections show one more rate hike, most likely in the December meeting. With September inflation coming in hotter than expected and no war resolution in sight, the Fed understands that inflation is now bleeding through to more than just energy costs and that it is moving in the opposite direction of its goal.
2. The Midterm Elections
Americans vote on November 3rd, and elections often bring a set of volatility with it, but unless there is any abnormal activity during the voting process then the uncertainty may turn into a more sophisticated move forward in markets. However, with fiscal pressures adding up, the outcomes may shape future policies, the deficit concerns, and the direction of the Iran war that many are already uneasy about.
3. 3rd Quarter Earnings
Earnings have been the strong suit of the market’s positive growth this year and are actually the main contributor to the bull run we have experienced since 2022. Expected growth is strong with many analysts continuing to raise their estimates, but the key test is whether these companies that have been driving the index performance can continue to deliver and bring optimism to investors during earning calls.
Sources:
1) Morningstar Direct (Data as of 9/30/2026)
2) JPMorgan Asset Management
3) Trademark Financial Management Research
4) YCharts (Data as of 9/30/2026)
5) YCharts (Data as of 9/30/2026)
DISCLOSURE
Past performance is no assurance of future results. Trademark Financial Management, LLC (“Trademark”) is a registered investment adviser with its principal place of business in the State of Minnesota. Trademark and its representatives are in compliance with registration requirements imposed upon investment advisers by those states in which Trademark operates. Trademark may only transact business in those states in which it is registered or qualifies for an exemption or exclusion from registration. This newsletter is limited to the dissemination of general information pertaining to its investment advisory/management services. Any subsequent, direct communication by Trademark with a prospective client shall be conducted by a representative that is either registered or qualifies for an exemption or exclusion from registration in the state where the prospective client resides. A complete list of all recommendations will be provided if requested for the preceding period of not less than one year. It should not be assumed that recommendations made in the future will be profitable or will equal the performance of the securities in this list. Opinions expressed are those of Trademark Financial Management and are subject to change, not guaranteed and should not be considered recommendations to buy or sell any security. For information pertaining to the registration status of Trademark please contact Trademark at (952) 358-3395 or refer to the Investment Adviser Public Disclosure web site (www.adviserinfo.sec.gov). For additional information about Trademark, including fees and services, send for our disclosure statement as set forth on Form ADV from us using the contact information herein or by calling 952-358-3395. Please read the disclosure statement carefully before you invest or send money. Any reference to a chart, graph, formula, or software as a source of analysis used by Trademark Financial Management staff is one of many factors used to make investment decisions for your portfolio. No one graph, chart, formula, or software can in and of itself be used to determine which securities to buy or sell, when to buy or sell them, or assist any person in making decisions as to which securities to buy or sell or when to buy or sell them. Any chart, graph, formula, or software used is limited by the data entered and the created parameters. The data was obtained from third parties deemed by the adviser to be reliable. Nonetheless, the adviser has not verified the results and cannot be assured of their accuracy.